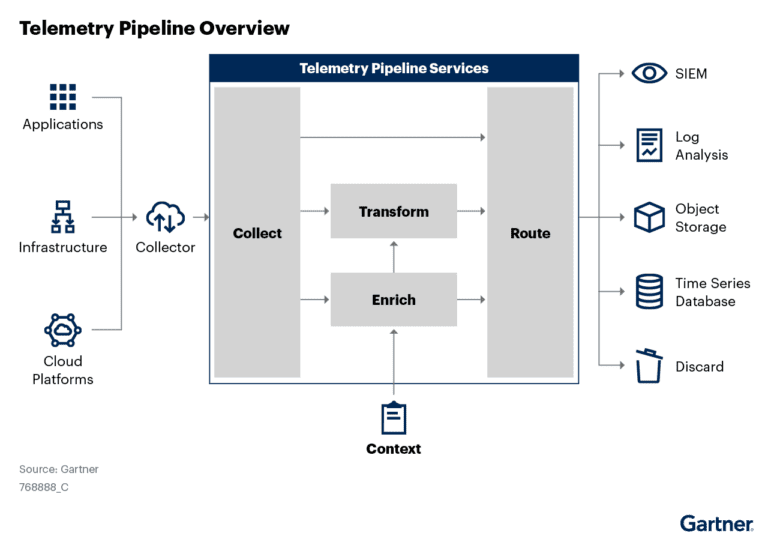
RabbitMQ is one of the most popular hybrid message brokers available today. It brokers inter-service communication between distributed microservices that make up an application. RabbitMQ consists of the RabbitMQ exchange and message queues and sits in between services that communicate with each other. When a producer forwards a message to RabbitMQ, the RabbitMQ exchange receives it, identifies the correct target message queue, and forwards the message to that queue for a consumer.
Just as any component in your distributed environment, you should also monitor and observe your RabbitMQ instance. Along with knowing when RabbitMQ errored out or dropped a message, you should also be able to exercise complete visibility into the broker to find out what led to the error, understand potential causes of failures, disruptions, or bottlenecks, and be alerted before something begins to fail.
Why RabbitMQ’s built-in monitoring isn’t enough
RabbitMQ ships with a management plugin with tools for monitoring, such as the management UI and an HTTP API that allows access to RabbitMQ metrics. The trouble is, the plugin is way too basic.
The management plugin collects and aggregates data about the system, and through the HTTP API, exposes several RabbitMQ metrics to the management UI. Although this setup is excellent for rudimentary monitoring or environments where it’s challenging to introduce external monitoring, it is by no means scalable. The management plugin only stores less than a few hours’ worth of data and is not built for long-term data or metric storage. The management UI also has several limitations, including a certain amount of management and setup overhead, no separation from the actual RabbitMQ system, and little to no visualization capabilities.
Why switch to monitoring with Apica?
Several external monitoring solutions are available in the market today that integrate with RabbitMQ and provide good visualization options and more extended metrics and log retention. The common trends observed with most of these tools are that they all pack massive storage bills for longer data retention, require proprietary tooling in the name of data convergence and enrichment, and require a special set of skills and plenty of investment to set them up correctly.
Apica is different. Apica is a unified data platform for monitoring, observability, log aggregation, and analytics with an infinite storage scale to bring simple and powerful logging to the masses.It uses object storage for data at rest and allows the sending of logs from Kubernetes, on-prem servers, or cloud VMs with ease. The use of object storage also means that neither do we dictate how much log data you can store and for how long, nor do we force you to favor logging specific components of your environment over others – you get to log everything.
The Apica platform includes:
- A User Interface (UI)
- A command-line toolkit
- A monitoring stack for time-series metrics
- A log analytics stack for log data, and;
- A free library for pre-built, no-code monitoring and observability dashboards, including one for RabbitMQ.
The ApicaHub dashboard for RabbitMQ includes visualizations, queries, and counters for critical RabbitMQ cluster-wide, node, queue, application-level, and health metrics. Along with the prebuilt queries and graphs, you can further setup new queries for RabbitMQ metrics using PromQL and convert RabbitMQ logs to metrics for better log-metric correlation; all within the Apica UI.
RabbitMQ monitoring with Apica
Setting up monitoring for your RabbitMQ instance with Apica is easy. All you need to do is:
- Install Apica
- Install Apicactl
- Import the RabbitMQ dashboard
Installing Apica
With Apica, you can take either the SaaS route or the PaaS route. For a cloud instance of Apica SaaS, head over to our website and register for a 14-day free trial of Apica SaaS. We’ll have your instance set up in no time.
On the other hand, there are plenty of deployment options to choose from if you’d like to try out Apica PaaS. You could go for the free-forever Apica PaaS Community Edition or try out our straightforward deployments on Kubernetes, AWS, MicroK8s, or Docker.
If you’d like to get up and running quickly, try out our Ansible playbook for installing Apica on Ubuntu using MicroK8s.
Installing Apicactl
Apicactl is Apica’s inbuilt command-line toolkit that lets you interact with the Apica Observability platform without logging into the UI. Using Apicactl, you can:
- Stream logs in real-time
- Query historical application logs
- Search within logs across namespaces
- Query and view events across your Apica stack
- View and create event rules
- Create and manage dashboards
- Query and view all your resources on Apica, such as applications, dashboards, namespaces, processes, and queries
- Extract and report log pattern signatures (up to a maximum of 50,000 log lines)
- Manage Apica licenses
Installing Apicactl allows you to import pre-built monitoring and observability dashboards for popular services from ApicaHub directly into your Apica instance.
The quickest way to start using Apicactl is to download a pre-built binary from our release page on GitHub. Once you’ve downloaded the binary, you can configure Apicactl to interact with your Apica instance by doing the following.
Step 1: Set your cluster URL:
Apicactl config set-cluster CLUSTER_URLStep 2: Provide your Apica credentials:
Apicactl config set-ui-credential flash-userid passwordStep 3: Set your default namespace:
Apicactl config set-context NAMESPACEStep 4: Verify your Apicactl configuration:
Apicactl config set-context NAMESPACEApicactl is now ready for use with your Apica instance.
Importing the RabbitMQ dashboard
Now that your Apica instance is fully ready for use let’s go ahead and configure and import the RabbitMQ dashboard.
- Head over to ApicaHub and click on RabbitMQ.
- Download the RabbitMQ dashboard JSON.
- Open the RabbitMQ dashboard JSON and edit the datasources section to add the Apica Prometheus endpoint. You can use your existing Prometheus endpoint instead of Apica’s if you choose to do so.
- Edit the RabbitMQ namespaces you wish to monitor.
- Run Apicactl to import the RabbitMQ dashboard JSON with the following command:
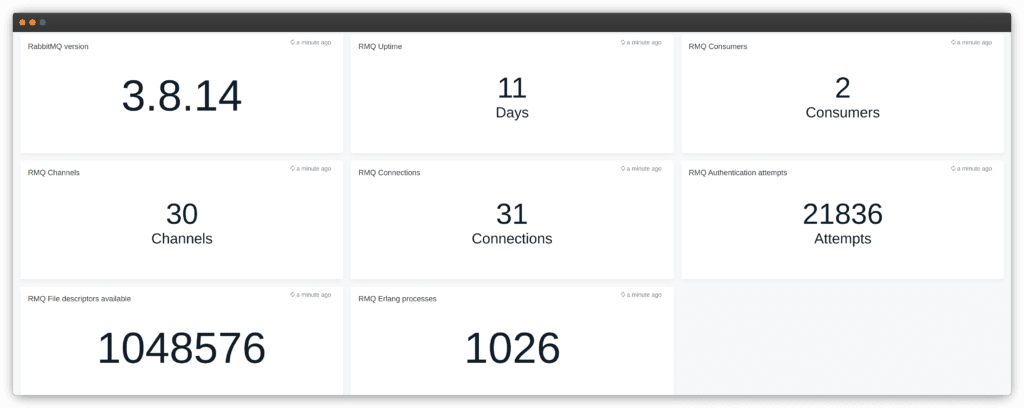
Apicactl create dashboard -f rabbitmq.jsonHead over to your Apica UI and navigate to Dashboards. You’ll now see a new RabbitMQ dashboard containing the default visualizations, counters, and queries for critical RabbitMQ metrics.
-

RabbitMQ metric counters on Apica -

RabbitMQ metric visualizations on Apica
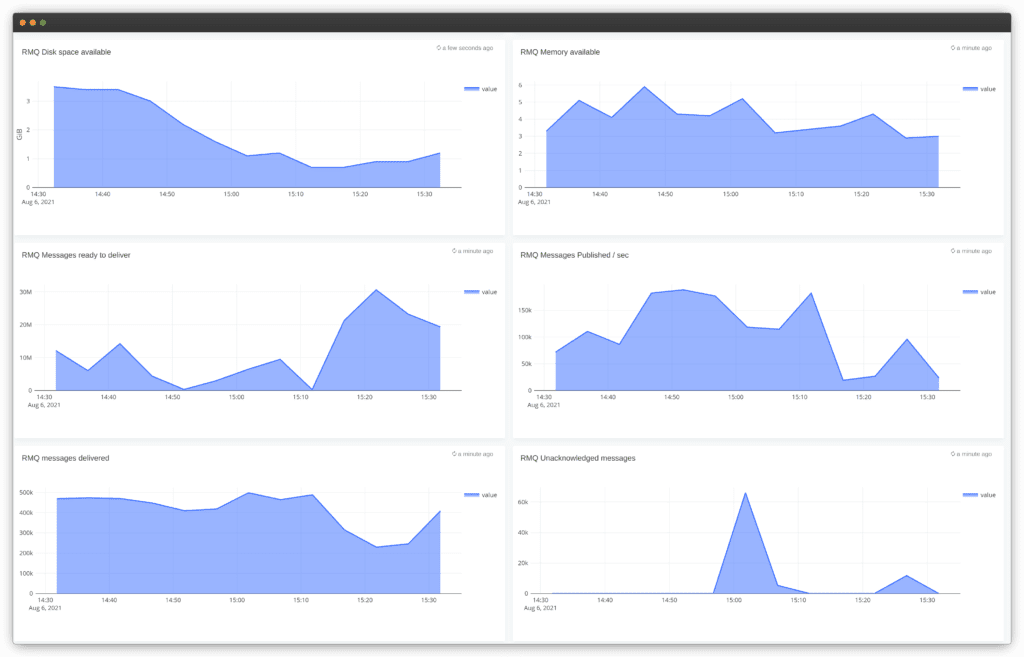
Like we mentioned above, you can further extend and customize these metrics, and set up new ones right within your Apica UI.
You can take your monitoring strategy several steps further by connecting Apica with every component of your infrastructure that RabbitMQ communicates with. Doing so will not only let you observe and monitor your infrastructure as a whole, but also enable you to easily correlate incidents and insights across subsets of your infrastructure. You can also integrate your existing alert channels with Apica and set up alerts so that your teams stay apprised of any event, limit exceedance, or incident of importance.
Conclusion
If RabbitMQ plays a crucial role in your distributed environment, monitoring and gaining visibility into its inner workings is vital, too. In this post, we’ve taken you through setting up Apica and integrating RabbitMQ with it. We’ve also seen how easy the set up is and how it enhances your strategy for monitoring RabbitMQ.
With Apica, you can observe every aspect of your RabbitMQ instance and its associated infrastructure in a single location. If you don’t yet have Apica, do sign up for a free SaaS trial or try out the free-forever, lightweight Apica PaaS Community Edition.