An Essential Guide to OpenTelemetry
In today’s expeditious, highly distributed software landscape, achieving true observability is no simple task. As you strive to understand how your applications and services perform and behave, you face multiple challenges.
Moreover, you need to instrument applications and services that generate data effectively, have a reliable means to transmit it, and, most importantly, find a way to visualize and derive insights from it. The sheer complexity of this process can be challenging.
That being said, how do you implement all of this observability stuff into your application or service?
Thankfully, there is a powerful solution at hand – OpenTelemetry. It is an open-source observability framework, that provides a comprehensive set of tools- APIs, and SDKs to help you instrument, generate, collect, and export telemetry data. Essentially, it opens the door to a deeper understanding of your software’s performance and behavior.
In this blog post, we’ll dive into the world of OpenTelemetry, exploring its history, benefits, and the pivotal role it plays in modern observability. We will also navigate where Apica weaves into the narrative.
What is OpenTelemetry?
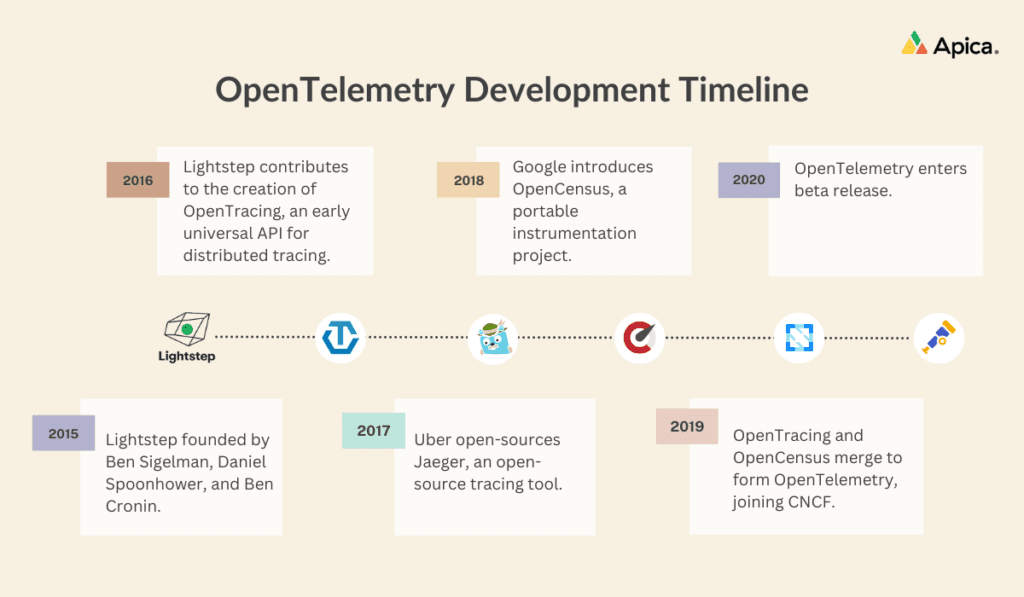
Today, OpenTelemetry has solidified its position as the 2nd most active project on CNCF, a testament to its growing importance in the world of observability.
How does OpenTelemetry work?
OpenTelemetry is vital in providing a holistic view of a monitored system’s behavior and performance, a critical for identifying and resolving issues, optimizing resource utilization, and enhancing user experience.
Beyond that, OTel introduces a standardized, vendor-neutral approach to collecting telemetry data, simplifying the integration of diverse data sources and systems into the monitoring process.
According to OpenTelemetry’s official documentation, the data life cycle unfolds through a series of essential steps which are as follows:
- Instrumentation: Developers employ dedicated APIs to specify which metrics to collect and how to gather them, seamlessly integrating telemetry data collection into their codebase.
- Data Pooling: SDKs come into play, pooling the data and facilitating its transportation for processing and exporting.
- Data Breakdown: The gathered data undergoes a comprehensive breakdown, involving sampling, filtering, and enrichment with contextual information from various sources.
- Data Conversion and Export: The data is converted into the necessary format and then exported.
- Filtering in Time-Based Batches: Further filtering occurs in time-based batches, refining the data for more effective analysis.
- Ingestion: The data finds its way to a backend, following two principal paths: local ingestion, where data is securely stored within a local cache, and span ingestion, which processes trace data in span format.
- Moving Data to a Backend: Finally, the data reaches a predetermined backend, which is stored, analyzed, and visualized, revealing valuable insights and patterns.
Additionally, you can integrate parts of Otel seamlessly for specific use cases due to the loose coupling of its components.
The primary components that constitute OpenTelemetry are:
- Application Programming Interfaces (APIs): OpenTelemetry provides a set of standardized APIs that allow developers to instrument their applications. These APIs capture and report telemetry data like traces and metrics. There are APIs for multiple programming languages, making it versatile for various development environments.
- Software Development Kits (SDKs): SDKs are language-specific implementations of the OpenTelemetry APIs. These SDKs make it easier for developers to instrument their applications in a specific programming language. OTel SDKs provide various features like automatic context propagation, sampling, and exporters.
- Data Specifications: OpenTelemetry defines standardized data formats and protocols for telemetry data, ensuring interoperability between different components of the observability ecosystem. This includes specifications for trace data (OTel Trace) and metric data (Metrics). These specifications provide a common language for describing telemetry data.
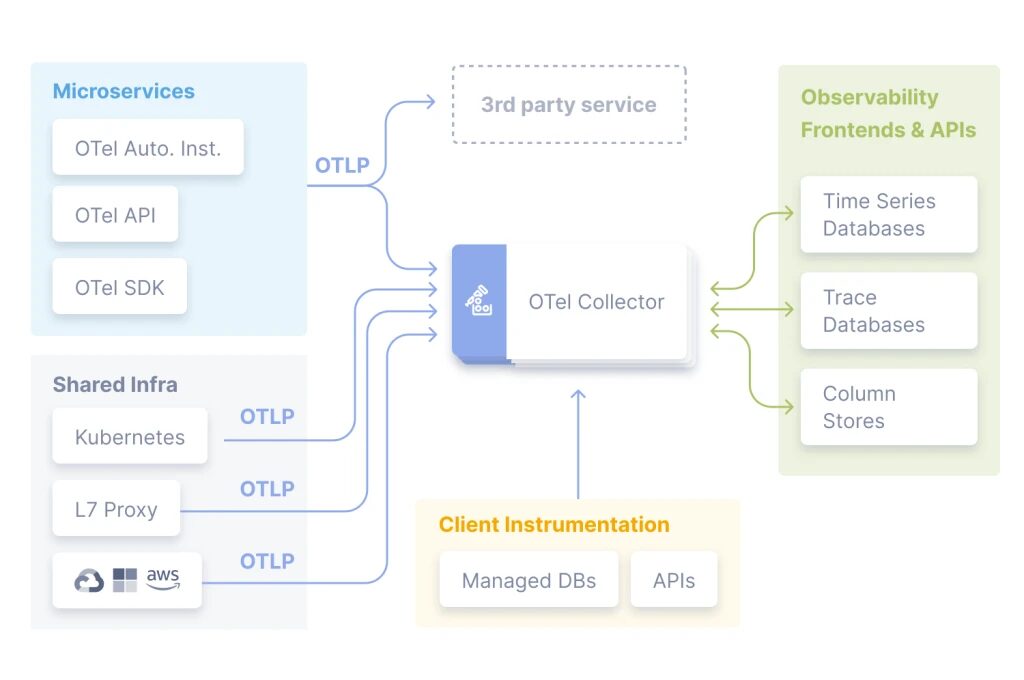
- OpenTelemetry Collector: The OpenTelemetry Collector is a critical component between the instrumented applications and the backend systems where telemetry data is processed and stored. It receives data from instrumented applications and can perform various processing tasks, including data filtering, transformation, and routing. The collector also supports various exporters to send data to different backends.
- Receiver: Receivers are components within the OTel Collector responsible for ingesting data from various sources, such as trace or metric data. They can be configured to accept data from a variety of protocols and sources.
- Processor: Processors within the OTel Collector are responsible for performing transformations and enrichment of telemetry data. This may include sampling, adding attributes, or performing other data processing tasks before the data is sent to an exporter.
- Exporter: Exporters are responsible for sending telemetry data to external systems, such as observability platforms or storage solutions. OpenTelemetry supports a range of exporters for various backends, including popular options like Jaeger, Zipkin, Prometheus, and more.
Benefits of OpenTelemetry
OpenTelemetry comes packed with an array of benefits that empower your observability journey:
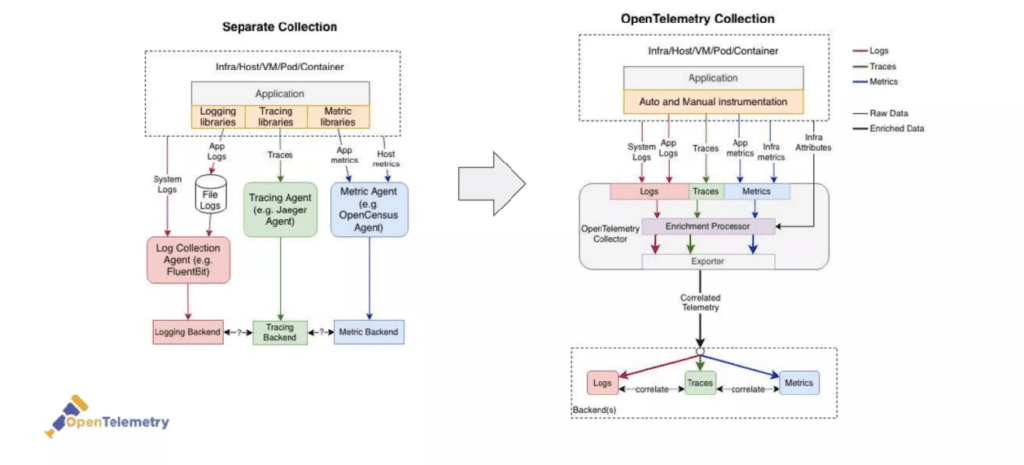
- Traces, Metrics, Logs: The framework allows you to create and collect telemetry data from your services and software and then efficiently forward it to various analysis tools. This trifecta of traces, metrics, and logs equips you with rich data for comprehensive insights.
- Drop-In Instrumentation: Integrating OpenTelemetry into your existing setup is a breeze. It seamlessly integrates with popular libraries and frameworks, such as Spring, ASP.NET Core, Express, Quarkus, and more. Installation and integration often require just a few lines of code, saving you time and effort.
- Open Source, Vendor Neutral: As an open-source and vendor-neutral solution, OTel is free and backed by industry leaders in the observability space. This ensures its continued growth and adaptability to meet evolving requirements.
What is OpenTelemetry used for?
One key challenge in a complex, microservices-driven ecosystem is context propagation. Individual requests can easily get lost in the noise when dealing with thousands of microservices at scale.
Furthermore, investigating issues becomes challenging, as events and metrics must be contextualized, a task that’s labor-intensive when done manually. OpenTelemetry shines here by automatically adding this context, making it easier to keep track of requests and investigate issues effectively
OpenTelemetry with Apica
Apica seamlessly fits into the OTel ecosystem, offering a fully compliant backend as part of the Apica Data Fabric.
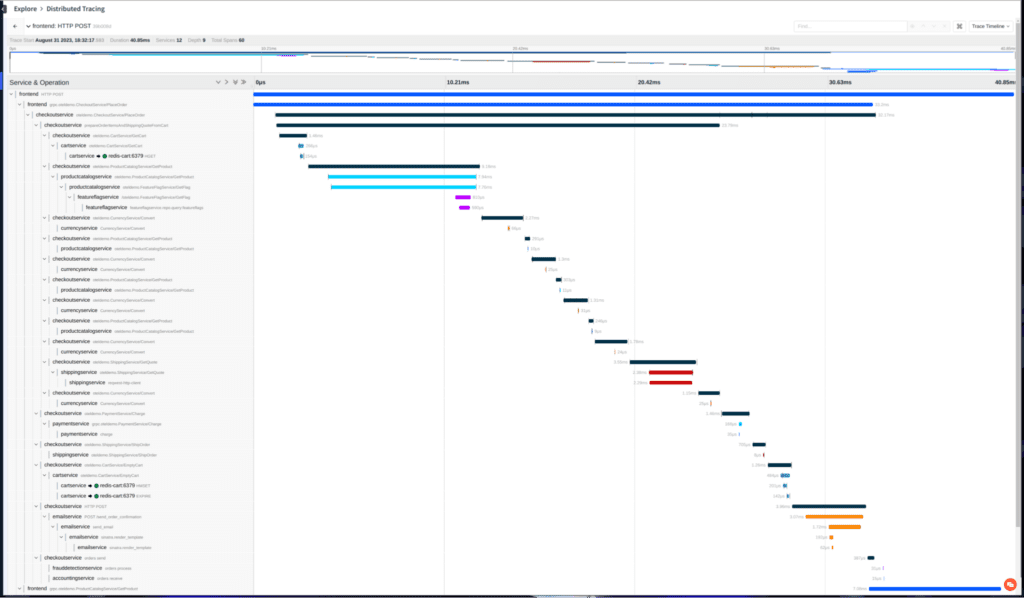
Ingesting OpenTelemetry data into our platform is a straightforward process. These traces can be easily visualized and analyzed within the Apica platform, streamlining your observability efforts.
Moreover, Apica has leveraged the capabilities of OpenTelemetry to breathe new life into logs. You see logs often lack context, making them less useful for debugging and issue pinpointing. Retrofitting tracing support to existing microservices can be resource-intensive.
Apica’s unique approach allows legacy data to be transformed into Otel spans and traces. It injects the necessary contextual information and stitches logs together on a unique identifier, enabling you to harness the full potential of traces without significant code changes.
Wrapping Up
OpenTelemetry has become a crucial tool in the modern observability landscape. It simplifies the complex task of instrumenting, collecting, and visualizing telemetry data, making it a must-have for any organization striving for comprehensive insights into its software performance and behavior.
Now, with Apica’s seamless integration, OpenTelemetry becomes an even more powerful asset, allowing you to elevate your observability game to new heights.
Curious to learn more? Sign Up for a demo today.
In a Glimpse
- OpenTelemetry simplifies observability in complex software landscapes.
- It offers a standardized approach for telemetry data collection.
- Integrates with various programming languages.
- Benefits include tracing, metrics, logs, and easy integration.
- Apica seamlessly integrates with OpenTelemetry.
- Apica’s unique approach allows legacy data to be transformed into Otel spans and traces.
Some images used in this blog are provided under the Creative Commons Attribution 4.0 International License (CC BY 4.0). You can find the full license details at https://creativecommons.org/licenses/by/4.0/. We thank the creators for their contributions and compliance with this license.


