- Platform
Fleet
Fleet Management transforms the traditional, static method of telemetry into a dynamic, flexible system tailored to your unique operational needs. It offers a nuanced approach to observability data collection, emphasizing efficiency and adaptability.
FLEET management
 100% Pipeline control to maximize data value. Collect, optimize, store, transform, route, and replay your observability data – however, whenever and wherever you need it.
Capabilities
 Apica’s data lake (powered by InstaStore™), a patented single-tier storage platform that seamlessly integrates with any object storage. It fully indexes incoming data, providing uniform, on-demand, and real-time access to all information.
Capabilities

The most comprehensive and user-friendly platform in the industry. Gain real-time insights into every layer of your infrastructure with automatic anomaly detection and root cause analysis.
- Resources
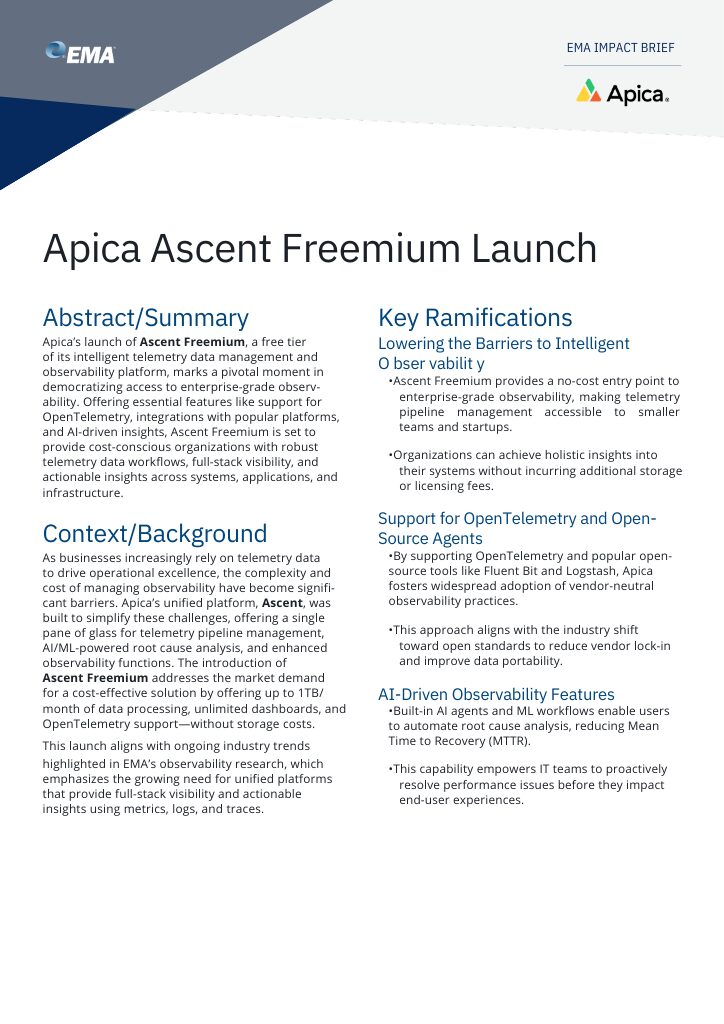
Apica Ascent Freemium Launch
Events & Webinars
Join us for live and virtual events featuring expert insights, customer stories, and partner connections. Don’t miss out on valuable learning opportunities!
Videos
Dive into valuable discussions and get to know our company through exclusive video content.Who is Apica?

Apica Ascent Freemium
Free Enterprise-Grade Telemetry Data Management and Observability is Here: Introducing Apica Freemium
DOCUMENTATION
Find easy-to-follow documentation with detailed guides and support to help you use our products effectively. - Solutions
by technology
- Company
About Us
Apica keeps enterprises operating. The Ascent platform delivers intelligent data management to quickly find and resolve complex digital performance issues before they negatively impact the bottom line.Security
In a world in constant motion where threat actors are everywhere it is important to always improve the security in all parts of your organization. We believe that is done by leveraging industry best practices and adopting the latest technology. We are proud to be both ISO27001 and SOC2 certified and thus your data is safe and secure with us.News
Stay updated with the latest news and press releases, featuring key developments and industry insights.
Apica Launches Ascent Freemium to Democratize Intelligent Telemetry Data Management and Observability.
Leadership
Meet our leadership team, dedicated to driving innovation and success. Discover the visionaries behind our company’s growth and strategic direction.Apica Partner Network
Join the Apica Partner Network and collaborate with industry leaders to deliver cutting-edge solutions. Together, we drive innovation, growth, and success for our clients.Careers
Build your future with us! Explore exciting career opportunities in a dynamic environment that values innovation, teamwork, and professional growth. - Login
Get Started Free
Get Enterprise-Grade Data Management Without the Enterprise Price Tag Manage Your Data Smarter – Start for FreeLoad Test Portal
Ensure seamless performance with robust load testing on Apica’s Test Portal powered by InstaStore™. Optimize reliability and scalability with real-time insights.
Monitoring Portal
Access the Monitoring Portal (powered by InstaStore™) to view live system performance data, monitor key metrics, and quickly identify any issues to maintain optimal reliability and uptime.
Request a demo
Let us show you how the Ascent platform can change the way you make sense of your data.
What you can expect
- An Apica expert will bring to life how Ascent can fit into your unique technology and organizational structures to meet your business goals.
- Comprehensive feature overview: We will share how Apica manages your operational data and gives you the insight you need.
- Competitive pricing information: We’ll share how our pricing model beats the competition and can work within your budget.
- Q+A: We will make sure you leave with a clear understanding of how Apica aligns with your business objectives.
- Post-demo support: Our team will be available to provide additional information to help you in the decision-making process.
Want to talk with us before you schedule a demo ?
Give us a call: +1 (310) 776-7540
International contact numbers can be found on our Contact page here.
Request a demo


