experience ascent
Navigate Your Tech Terrain Effortlessly with Apica's Ascent Experience
Apica brings you an all-encompassing view of your technology environment, covering everything from logs and metrics to traces and APIs. With our intuitive drag-and-drop dashboard interface and smooth integrations with popular tools like Prometheus and Elasticsearch, managing your tech stack has never been easier.
- Topology
- Distributed Tracing
- Log Management
- Dashboards
- AI/ML/GenAI
- Security
- Live Tailing
- Settings and Configuration
- Data Explorer
- Rule Management
- Pipeline
- Synthetic Monitoring Check Creation
- Synthetic Monitoring Check Configuration
- Synthetic Monitoring Check Results
Viewing your ingested data
The Topology View feature transforms how you interact with ingested data. It’s designed as a logical topology browser, enabling you to group and work with applications and data seamlessly. This intuitive approach means that related applications and data are easily accessible in one place.
- Logical Data Grouping: Utilizes a topology browser for aggregating data into logical clusters, facilitating correlated analysis of applications and datasets.
- Error Aggregation: Integrates errors and warnings in the topology for a consolidated view, optimizing monitoring efficiency.
- Chronological Navigation: Enables historical data traversal, allowing users to retrospectively analyze error propagation for accelerated root cause identification.
- Customizable Groupings: Supports configuration of application groupings based on relationships, geography, or organizational structure, aligning with enterprise operational strategies.
- Operational Synchronization: Reflects organizational structures in topology navigation, ensuring alignment with internal operational processes for streamlined management.
Viewing issues from Topology browser
The color-coded nodes quickly highlight errors and warnings, streamlining your troubleshooting process. Plus, Application nodes provide convenient shortcuts, enabling you to directly search for specific errors and warnings within your data.View error propagation from Topology Browser
To effectively identify the origin of errors in a data environment, our Topology Browser’s Time Travel feature allows users to retrospectively view system changes. This tool uses a color-coded system, where a node shifting from green to yellow or red indicates a detected issue. This visual approach swiftly pinpoints where and when problems began, simplifying the root cause analysis.Attribute-Based Trace Search
Apica’s distributed tracing view facilitates trace searches using attribute-based criteria. Users input specific attributes and values, prompting the system to retrieve matching traces and spans.
1. Criteria Input: Define attributes and their corresponding values for the search.
2. Systematic Search: Apica’s system conducts a thorough scan to find matching traces and spans.
3. Visualization of Results: The interface displays the matching traces, allowing for clear and organized data analysis.
Key Advantages
Targeted Search: Enables precise filtering based on specific data attributes.
Efficiency: Streamlines the search process, reducing time spent on data retrieval.
Clear Data Presentation: Facilitates easy interpretation and analysis of complex trace data. “
Searching Logs
Users have the flexibility to sift through logs by selecting their desired time range. Choose from a predefined set of relative time options or use dynamic relative time range selector for sepcific log searches.
Creating Advance Query for logs
Build complex expressions in a search query for searching logs. Advance Query supports the use of complex expressions in the search query for log search.
Quick access of the search query
The favorites feature allows you to mark your search queries for quick and easy access in the future. Simply mark a query as a favorite, and you’ll be able to retrieve it swiftly the next time you need it.
Using Pre-defined Dashboards
The Import Dashboard feature lets you quickly leverage pre-defined dashboards tailored for common use cases, enabling efficient monitoring of your application and infrastructure. Avoid the hassle of building complex dashboards from scratch and gain insights faster with just a few clicks.
Creating Dashboard
Apica Ascent equips you with advanced monitoring tools for your applications and infrastructure. These tools allow you to easily track metrics, identify anomalies, and receive early warnings to prevent incidents.Time-series Metrics Anomaly Detection
Detecting anomalies in metrics like the network-receive-byte count is simplified through machine learning techniques applied to time-series data. Here’s a streamlined process that anyone can follow, regardless of technical expertise:
Start with Pre-Formed Time-Series Data: Choose your metric data set for analysis.
Generate Data with a Query: Use a specific query to produce the time-series data you’re interested in.
Visualize with a Chart: View the generated data on a plotted time-series chart, which will display two sets: the original data (e.g., Network-total-received bytes) and the detected anomalies.
Adjust Anomaly Detection: Users have the option to fine-tune the sensitivity of anomaly detection to achieve the most accurate results.
Initially, set the anomaly detection strength to 40% and observe the highlighted anomalies.
- Adjusting the detection level will likely reveal more anomalies, prompting a need for balance to avoid false positives.
- Iterate with Different Settings: Experiment by increasing the anomaly detection strength to 60% and re-generate the data.
Enhancing Security Log Readability with Gen-AI
Interpreting security event logs can often be a challenging task due to their complex nature. However, leveraging Gen-AI technology can significantly aid in understanding these logs more clearly.
By integrating Gen-AI into your log event explorer, you can streamline the process of analyzing and interpreting security logs. Here’s how to make the most of Gen-AI for security log analysis:
- Navigate to the logs view within your OSSEC system.
- Choose a selection of log events that you wish to analyze.
- Open the Gen-AI chat interface.
- Pose questions directly related to the attributes found within the log data.
Streamline Your Security and Compliance Monitoring
OSSEC stands as the most popular Host-based Intrusion Detection System (HIDS) for meticulous security monitoring and capturing compliance evidence. The Apica Ascent Platform fully supports OSSEC, along with its enhanced capabilities, ensuring a robust security framework for your organization.
Our tutorial showcases the simplicity and speed of deploying OSSEC within Apica.
Follow these straightforward steps:
- Navigate to Integrations: Locate and select the OSSEC extension to integrate its capabilities into your environment.
- Explore OSSEC Logs: Switch to the Explore view to access and analyze OSSEC logs in real-time, enhancing your security monitoring and compliance documentation.
Setting up the enhanced OSSEC server on Apica for your end devices is straightforward, ensuring a fortified security posture and streamlined compliance monitoring.”
Live Tailing Telemetry Data
Logs Live Tail streamlines troubleshooting by offering a real-time stream of new log events as they arrive. This feature enables you to swiftly detect and address issues by viewing, filtering, and highlighting logs almost instantaneously.
To use Live Tail, navigate to the explore view, select your desired namespace/application, and start tailing logs live. You also have the option to pause the live stream and download the logs you’ve tailed for further analysis or record-keeping.
Configuring Timezone
The TimeZone setting gives users the capability to set the timeZone based on their preference. Choose the prefered timezone from the dropdown meanu or search for the relavant keyword.
Configuring SAML
Users can enable SAML login from the settings for ease-of-access in logging in to the application.
Configuring Mail Server
Users can configure emails to forward alerts and send email invites by anvigating to the mail tab in settings and configuring the details.
Searching for Namespace and Application
Filter the namespace or application based on the keyword search, or select multiple namespaces to filter out your data.
Rules and Rule Packs
In Apica Ascent, rules and rule packs play a pivotal role in data management, allowing users to effectively manage the cost and flow of their data. Here’s a
concise overview
Creating Rules: Users can create a new rule within a specific namespace and application flow. This is done by hovering over any log line and selecting “”Create rule.”” Once established, the rule applies to every log incoming in that flow.
Types of Rules
Filter Rule: It filters events based on certain criteria, controlling the volume of data stored or processed. For example, you can create a filter rule to drop all log lines containing DEBUG or INFO severity levels.
Extract Rule: This rule helps extract unstructured data from log lines using re2 RegEx pattern expressions. It evaluates incoming log lines and extracts specified fields.
SIEM (Log-to-Metric) Rule: Converts incoming log data into real-time timeseries metrics. It’s used for visualizing log data, plotting distributions, creating custom indexes, and alerting for events like user login failures or load-balancer status codes.
Rewrite Rule: Used for redacting or replacing sensitive data in compliance with data security regulations. It utilizes RegEx to match and mask patterns in incoming data.
Forward Rule: Applied when routing logs to downstream destinations. These rules can be used to selectively forward data, ensuring compliance and reducing data volume.
Rule Packs: Rule Packs are collections of various types of rules (FILTER, EXTRACT, SIEM, REWRITE, FORWARD). Users can access built-in rule packs or create new ones. Each pack can be edited to suit specific needs and activated or deactivated as required.
Managing Rules: Users can view, edit, and delete rules via the rules list page, which offers filters and status checks. The detailed view of each rule is accessible, providing options for modification or removal.
Filter Rules in Apica Ascent
Apica Ascent’s filter rules are key for efficient data management, allowing users to control data costs and streamline data flow. These rules enable you to specify criteria that log data must meet to be collected, thus filtering out irrelevant data. This process not only helps manage storage costs by reducing the amount of data stored but also enhances data analysis efficiency by focusing on relevant information.
Extract Rules in Apica Ascent
Apica Ascent’s extract rules are designed to efficiently manage data costs and flow by transforming unstructured log data into structured formats. This process allows for precise data analysis and forwarding to targeted destinations through forward rules.
How They Work
Extract rules identify and extract relevant information from unstructured data based on predefined patterns, converting it into a structured format ready for further processing.
Using Extract Rules
- Define the Rule: Specify what information to extract from the unstructured data.
- Apply the Rule: Implement the rule on your data, allowing it to identify and extract the specified information.
- Transform Data: The rule converts extracted information into a structured format.
- Forward Data: Use forward rules to send the structured data to chosen destinations for further use.
Extract rules simplify the management of unstructured data, making it easier to analyze and process, leading to more efficient data workflows and cost savings.
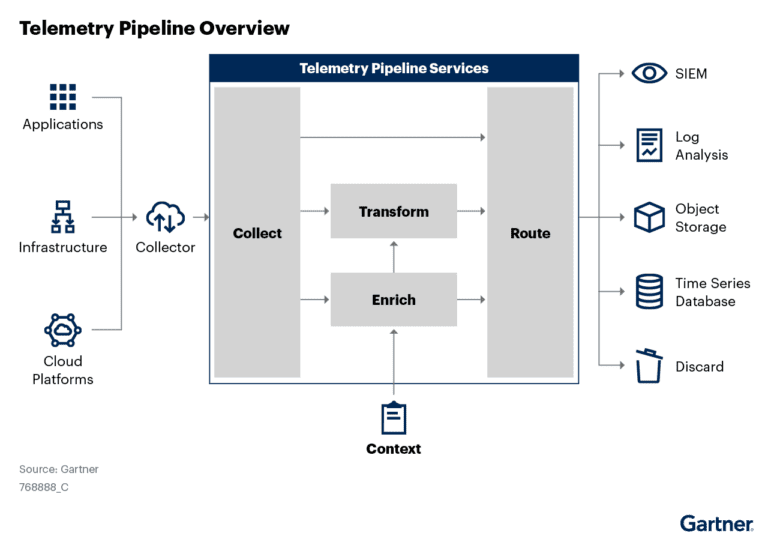
Explain about Data Flow Pipelines
A data pipeline orchestrates the flow of data through a predefined series of steps or processes. It’s designed for systematic and efficient data movement and transformation, incorporating various operations such as filtering and rule application to manage the data stream.
Create Browser Check
Creating a browser check is an essential and widely-used method for tracking user interactions and experiences on your platform. Here’s how to efficiently set one up:
Create URL Check
The following are the steps for creating a URL check for users:- Begin by clicking on ‘New Check’ to initiate the creation of a new check.
- Select ‘URL v2’ to set up a URL check.
- Provide a name for your URL check.
- Optionally, add a description for the URL check.
- Optionally, add a tag to categorize the URL check.
- Click ‘Next’ to proceed.
- Enter the URL that you want to monitor.
- Choose a location from where you want to monitor the URL check.
- Click ‘Next’ to move forward.
- Decide whether you want the check to run manually or at intervals.
- If you choose ‘Interval,’ specify the frequency of the checks.
- Optionally, assign this URL check to an existing group.
- Click ‘Next’ to review the configurations of the check.
- Finally, click ‘Create’ to confirm and create the URL check.
Edit URL Check – Check Configurations
Steps for Configuring URL Checks:
- Click on the “EditCheck” button located in the top right corner of the screen.
- Change the “Request Method” as needed.
- Enable or disable the check based on your requirements.
- Modify the location where the check will be performed.
- Adjust the frequency from “Manual” to “Interval” for automated checks.
- Set the number of retries if the check fails during execution.
- Specify an “Inclusion Period” to define when the check should run.
- Define an “Exclusion Period” to indicate maintenance windows when the check shouldn’t run.
- Set up “Thresholds” to receive alerts if the response time exceeds or falls below defined values.
- Update or change the monitor group associated with the check.
- Implement any additional configurations necessary for your specific monitoring needs.
- Remember to save any changes made to the configuration.
Edit Check – Change Interval Inclusion/exclusion periods
Customize your check settings for optimal performance by specifying exactly how and when it should run. Take advantage of features like Inclusion/Exclusion periods, customizable intervals, maximum attempts, and pause durations between attempts to tailor the check to your precise requirements.Edit Check – Configure block rules/sev mapping
Reduce the noise by slimming down the amount of URLs they are monitoring. This is done through block rules, ignore file types and severity mapping.Three clicks to root cause – show headers
Use a swift, three-click process to identify the underlying cause of a failure in a synthetic check. Watch as we pinpoint the application error responsible for disrupting a Synthetic script’s performance.