“Isn’t observability just a fancy term for monitoring?” That’d be the response from most IT folks a few years back if you asked them about it. And here we are in 2023, where Observability now is as imperative a term as security itself.
Observability, as a concept in software engineering and system monitoring, has met with its share of criticisms – complexity, cost concerns, data overload, integration challenges, and skill gaps are a few concerns associated with observability. Despite these challenges, today it has become an integral part of software deployment.
In this extensive guide, we’ll dive deep into the world of Observability. Exploring what is observability, along with its history, importance, benefits, and challenges. We’ll also explore how Apica is transforming the observability space with its Operational Data Fabric architecture and most recently with its Generative AI integration.
What is Observability?
“Observability is not the microscope. It’s the clarity of the slide under the microscope.”
— Baron Schwartz
Observability is generally about how well you can figure out what’s happening inside a system by looking at what it’s showing on the outside.
Put simply, observability is all about knowing what’s going on inside your code or system just by using your tools to ask the right questions. Think of it like the dashboard in a car. The dashboard has features that let you see how the car is doing – like its speed, RPM, temperature, etc.
In the IT cloud landscape, observability refers to the capability of assessing the status of a system through the analysis of the data it produces, most notably but not limited to logs, metrics, and traces.
In recent years, the scope of observability data has widened. From today’s complex distributed system’s standards, it ought to include additional metrics like metadata, user behavior, topology, and network mapping.
What’s the difference between Monitoring vs Observability?
In the realm of IT software development and operations, the concepts of monitoring and observability are often conflated. The gist of the matter is that they are complementary to each other albeit with distinct technical functions.
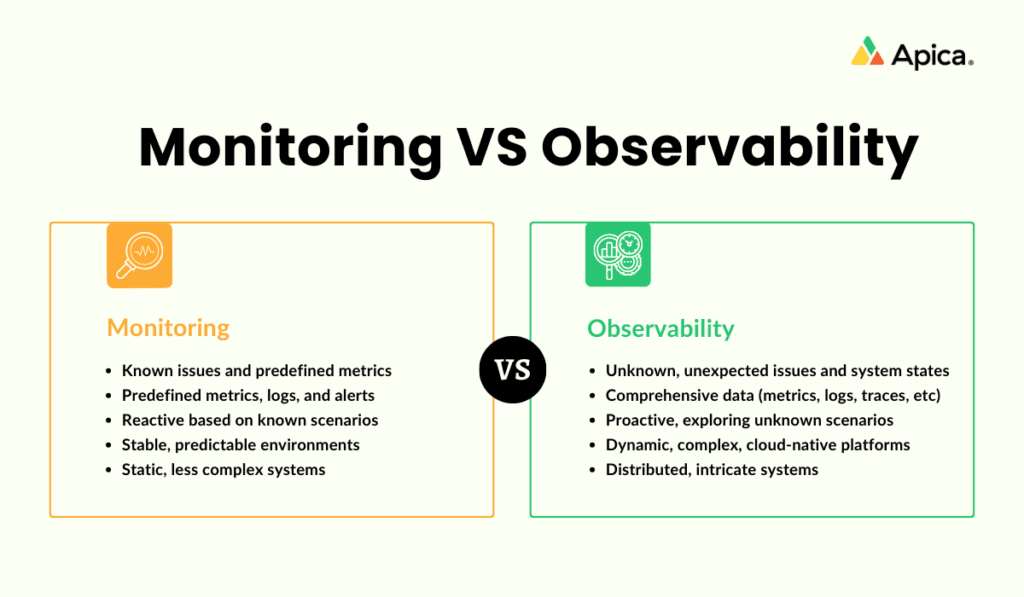
Monitoring is a more traditional approach, characterized by its reliance on predefined metrics and logs. The core assumption in monitoring is the ability to anticipate potential problems based on historical data and experience, setting up systems to alert when these predefined conditions are met. This approach works well in more static and predictable environments but encounters limitations in more dynamic contexts.
Observability, on the other hand, represents a more holistic and nuanced approach, particularly essential in the context of complex, cloud-native platforms. Unlike monitoring, observability doesn’t solely rely on predefined metrics or known issues. Instead, it focuses on the collection and analysis of a wide array of data (including metrics, logs, traces, etc.) to provide a comprehensive understanding of the system’s state. This approach allows for the identification and diagnosis of unforeseen or complex issues that arise due to the intricate interactions within distributed, cloud-native applications.
History of Observability
The fascinating history of observability in computing is a journey that traces back to concepts in control theory and evolves alongside technological advancements.
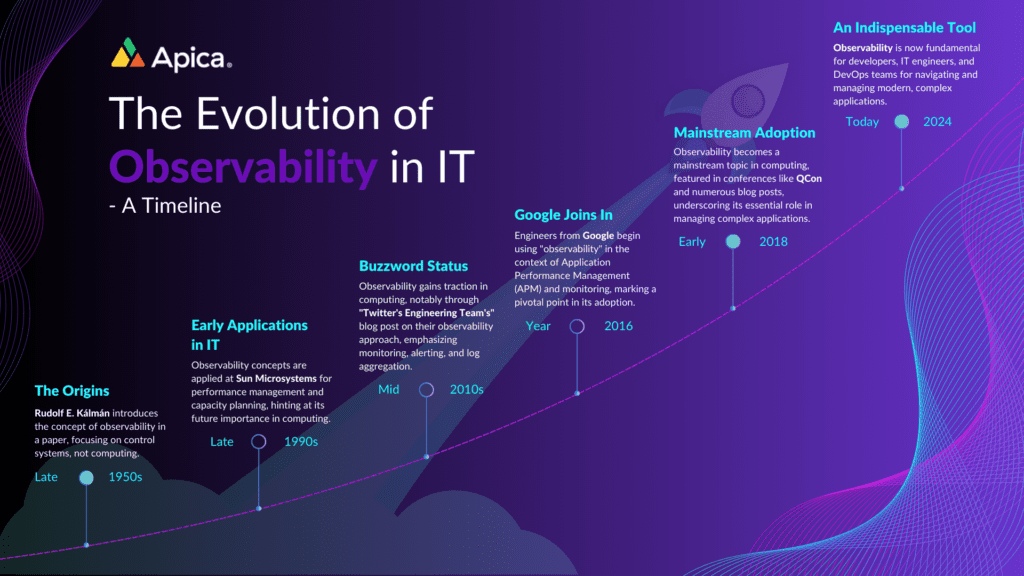
- Origins in Control Theory (1950s): The term “observability” was initially introduced by Rudolf E. Kálmán in 1959. Kálmán, a Hungarian-American scientist, wasn’t focused on computing but on broader system theory and signal processing. His work laid the groundwork for understanding how the internal state of a system can be inferred from its outputs, a principle that would later become pivotal in computing.
- Early Application in Computing (1990s): While observability remained primarily within signal processing and systems theory, it began to see applications in computing by the late 1990s. At Sun Microsystems, for instance, observability was considered essential for performance management and capacity planning. This perspective differed from the modern view, where observability encompasses a broader role, including application performance management (APM).
- Rise in the Computing Domain (2010s): The concept of observability gained significant traction in the field of computing in the mid-2010s. A notable development was a blog post from Twitter’s Observability Engineering Team in 2013, highlighting the use of observability in monitoring, alerting, distributed tracing, and log aggregation. This period marked the transition of observability into a mainstream concept in computing, frequently discussed in industry conferences and publications by early 2018.
Fast forward to today, observability is ubiquitous in the IT and cloud landscape. A 2021 survey by Enterprise Strategy Group highlighted the growing recognition of observability’s importance in IT, with almost 90% of IT leaders expecting it to become a critical aspect in the coming years.
Benefits of Observability
The benefits of observability in IT and computing are numerous and significant, particularly in the context of modern, complex systems:
1. Enhanced System Understanding: Provides deep insights into the workings of a system, allowing for a better understanding of its behavior under various conditions.
2. Improved Problem Detection: Enables early detection of issues, often before they impact users, by analyzing patterns and anomalies in system data.
3. Faster Issue Resolution: With detailed information about system states, teams can quickly diagnose and address problems, reducing downtime.
4. Proactive Management: Observability allows teams to anticipate issues based on trends and patterns, leading to more proactive system management.
5. Optimized Performance: By understanding how different aspects of a system interact, it’s possible to optimize performance and resource usage.
6. Better Customer Experience: A more reliable and efficient system, resulting from effective observability, leads to a better end-user experience.
7. Data-Driven Decisions: Observability provides valuable data to inform strategic decisions about system improvements and resource allocation.
8. Scalability and Adaptability: As systems grow and evolve, observability tools can scale and adapt, providing continuous insights regardless of system complexity.
How does Observability work?
Observability is essentially a master key to understanding everything happening in your multi-cloud computing environments. Imagine it gathering insights from all corners – hardware, software, cloud infrastructure, you name it. The goal is crystal clear: get a grip on what’s happening across your systems to swiftly tackle any issues and ensure everything is ticking along nicely.
Now, setting up observability involves a bit of mix and match with different tools, OpenTelemetry being a popular choice. The best part? It’s not just a tech thing. Diving into observability data opens a treasure trove of insights that can really drive smarter business decisions. It’s a win-win for both the IT folks and the business side of things.
Understanding Data Control
Data control is a vital aspect of any observability strategy. It involves various practices such as data filtering, enhancing data with additional context (data augmentation), reducing the volume of data, managing costs, and allowing flexible data retention as needed. For example, while some observability data might be stored for 30 days (about 4 and a half weeks), others might be retained for a year.
Data filtering specifically refers to removing sensitive or unnecessary information from your data before it’s processed or stored. Techniques like whitelisting, blacklisting, and customized filters are used for this purpose, ensuring that your observability data is both relevant and secure.
Importance of Observability
With the rise of cloud-native services and complex interdependent systems, traditional monitoring falls short in tracking and diagnosing issues across these intricate networks. Observability fills this gap, offering comprehensive visibility into multi-layered systems and enabling quick identification of problems’ root causes.
The following describes where the significance of observability is highlighted:
- Understanding Complex Systems: Observability aids cross-functional teams in deciphering the workings of highly distributed systems.
- Improving Performance: It identifies slow or broken elements, guiding performance enhancements.
- Proactive Issue Resolution: Alerts teams about potential problems, allowing for quick fixes before user impact.
- Adapting to Modern Technologies: Essential for enterprises using cloud-native services, microservices, and container technologies.
- Visibility Across Systems: Offers comprehensive insights into intricate, multilayered systems.
Notable Applications:
– Stripe: Utilizes distributed tracing for failure analysis and fraud detection.
– Twitter: Monitors service health and supports diagnostics through observability.
– Facebook: Employs distributed tracing for app insights.
– Network Monitoring: Identifies root causes of performance issues, often network-related, streamlining problem resolution.
Best Practices to Implement Observability
As enterprises increasingly adopt microservices, cloud platforms, and container technology, it’s vital to integrate observability into their frameworks. Here are key best practices for implementing observability:
- Create an Observability Team: Form a dedicated team responsible for developing and owning the observability strategy within your organization.
- Define Key Observability Metrics: Analyze business priorities to determine essential metrics and decide which data to monitor across your technology stack.
- Document Standards for Governance and Data Management: Ensure compatibility in data formats and structures across various data types, especially in large, siloed organizations.
- Centralize Data and Select Analytics Tools: Establish a unified framework for data collection and routing to analytics tools, fostering cross-divisional collaboration.
- Educate Teams for Proficiency: Conduct regular training for staff to build understanding, encourage engagement, and achieve optimal observability outcomes.
Tools and Trends in Observability
In today’s highly distributed, complex system landscapes, several tools and methodologies have become commonplace in enhancing observability, let’s have a look at the most prominent ones:
1. Distributed Tracing: Tracks requests across networks, illuminating interactions within a system.
2. Metrics: Assess system efficiency and performance, pinpointing slowdowns and monitoring KPIs.
3. Logging: Involves collecting and storing system logs, aiding in problem-solving and usage analysis.
4. Synthetic Monitoring: Simulates user interactions to test web application performance and availability.
5. Containerization and Kubernetes: Simplify deployment and management, enhancing observability in complex environments.
6. Anomaly Detection: Identifies unusual patterns in data to promptly detect potential system issues.
7. Application Performance Management (APM): Monitors and improves application performance, identifying bottlenecks and diagnosing issues.
8. AI-based Observability: Gains traction for its ability to automatically detect issues, identify anomalies, and predict upcoming trends.
Furthermore, incidents like the COVID-19 pandemic significantly accelerated a growing trend towards digitalization. Recent data from Synergy Research Group reveals a significant surge in enterprise investment in cloud services during the third quarter, influencing enterprise behaviors and hastening the shift from on-premises operations to cloud-based solutions.
There’s more to Modern Observability than the 3 Pillars
Observability is to DevOps what a compass is to Navigation.
In the last few years, data has evolved exponentially. Be it in terms of volume, complexity, variety, or velocity. Therefore, in the modern context of observability using the renowned 3 pillars of observability is simply not enough.
Modern observability demands the inclusion of elements like metadata, detailed network mapping, user behavior analytics, and in-depth code analysis. Moreover, the mere collection of data isn’t the endgame; the real power lies in leveraging this information to enhance user experiences and drive better business outcomes.
As a solution, open-source tools, like OpenTelemetry, are crucial for enhancing observability in cloud environments, ensuring consistent application health across various platforms.
Furthermore, real-user monitoring (RUM) and synthetic testing are indispensable for real-time insights into user experiences. They allow for a holistic view of each request’s journey and system health, empowering teams to preemptively address potential issues and understand user interactions more deeply.
Hence, the extended telemetry data, encompassing APIs, third-party services, browser errors, user demographics, and application performance from the users, is vital for a nuanced understanding of observability in today’s tech landscape.
Navigating Observability in DevOps
If you’re a DevOps engineer, you’d get the practicality of the above statement and even if you aren’t, you must. Modern DevOps is highly complemented by Observability principles, in that DevOps Observability equips teams with enhanced insights into the system’s performance throughout the development process, a crucial element for maintaining system efficiency.
Thus, enabling immediate identification and resolution of defects and bugs ensures that such issues do not escalate, thereby enhancing the overall customer experience.
The importance of observability in DevOps is multi-faceted, enhancing the ability of teams to effectively manage and optimize complex software systems.
Here’s a quick overview of that:
- Enhanced System Understanding and Problem-Solving: Observability in DevOps is crucial for ensuring smooth operations and efficient problem-solving. It enables teams to gain insights into the inner workings of systems based on external behavior, aiding to understand and debug complex software applications, infrastructure, and services effectively.
- Comprehensive Visibility: Observability offers a holistic view of the system, going beyond traditional monitoring. It includes three key pillars: logs, metrics, and traces. Logs provide a detailed diary of events, metrics offer numerical measurements of system performance, and traces track the journey of specific requests or transactions.
- Transparency and Performance Optimization: It provides transparency into software system behavior and performance, critical for DevOps. By using observability tools, teams can quickly identify issues, optimize processes, and improve customer experiences. This includes logging to record events, metrics for performance efficiency, and tracing to monitor request paths.
- Operational Efficiency and Customer Satisfaction: Observability plays a pivotal role in DevOps by offering detailed insights, enabling informed decision-making, and continuous system improvement.
- Support for DevOps Principles: The transparency and insights provided by observability are essential for teams operating with DevOps principles such as automation, autonomy, knowledge sharing, and rapid experimentation.
In short, observability in DevOps is a powerful set of tools that provides visibility into what’s happening behind the scenes, allowing teams to manage complex software systems more effectively and efficiently.
Why does Observability need a Data Fabric?
What is a Data Fabric?
Data Fabric is an advanced methodology for effective data management. It’s a comprehensive solution encompassing architecture, data management, and integration software, providing unified and real-time data access across an organization.
The Role of Data Fabric in Observability
Why Data Fabric is Essential
Active Observability and Apica’s Operational Data Fabric
Apica’s Operational Data Fabric is designed to deliver Active Observability, providing a comprehensive and user-friendly platform for enterprises. This is achieved via:
- Actionable Insights Across Data Types: Apica enables detailed insights into various data forms, including logs, metrics, events, traces, and more, ensuring complete visibility and understanding of the entire infrastructure.
- Efficient Data Management: With Apica, organizations can build a robust observability data lake. This tool facilitates the collection, optimization, analysis, routing, and management of log data across the entire technology stack, enabling control over pipeline and data flow.
- Advanced Performance Troubleshooting: Utilizing OpenTelemetry and Jaeger-compatible Distributed Tracing, Apica offers powerful tools for analyzing and troubleshooting performance issues, enhancing operational efficiency.
- Kubernetes Observability: Apica provides comprehensive observability for Kubernetes environments, allowing for the ingestion of logs and metrics from various Kubernetes components and applications, all through a single interface.
- AI-Driven Anomaly Detection: The integration of machine learning and natural language processing techniques allows for automatic anomaly detection, pattern recognition, and causality determination within observability data, optimizing performance and enhancing efficiency.
Thus, Apica’s data fabric solution transforms the way businesses approach observability, offering a seamless, efficient, and highly effective platform for gaining real-time insights, optimizing performance, and delivering exceptional customer experiences.
How Generative AI Complements Observability
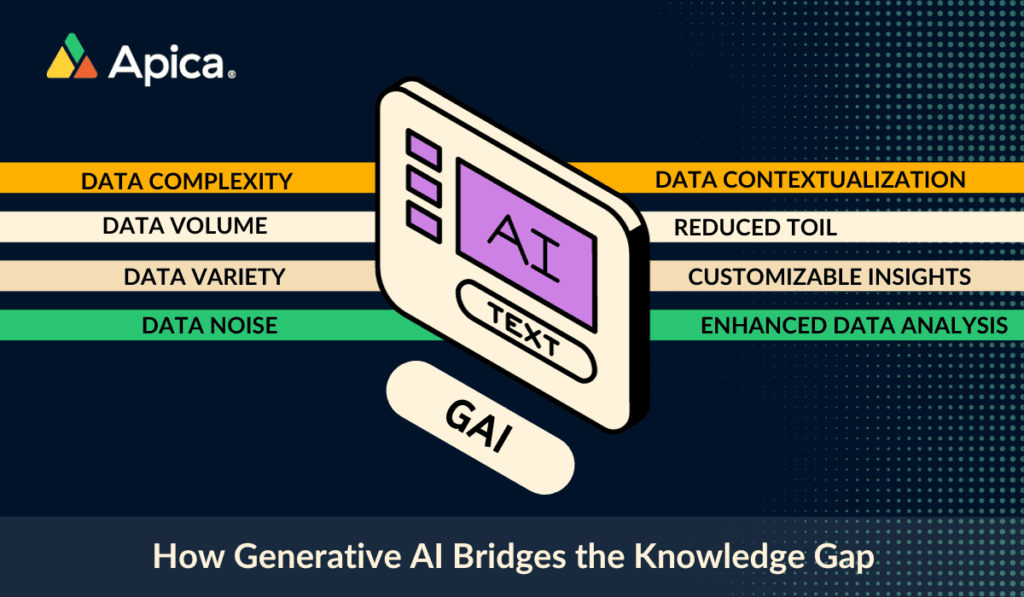
In our recent blog post, we talked about how Generative AI is bridging the knowledge gap. When it comes to data observability, it serves as a powerful tool to enhance the benefits and upscale productivity. Let’s explore a few ways in which generative ai integrations do that.
Root Cause Analysis
Enhanced Data Visualization
Generative AI can create sophisticated visual representations of complex data sets. This makes it easier for humans to understand intricate patterns and relationships within the data, providing a clearer picture of the system.
Predictive Analytics
Generative AI can predict future states of the system by analyzing historical data. This foresight is crucial in data observability, as it allows for proactive measures to be taken before issues become critical, thus filling in the gaps in understanding future system behavior.
Enhancing Decision-Making
By providing context and actionable insights, generative AI aids in informed decision-making. Users can rely on AI recommendations to make choices based on a deeper understanding of the data.
Efficiency and Time Savings
Manual data analysis can be time-consuming. Generative AI automates this process, saving time and effort. It quickly processes data, extracts valuable information, and presents it in an understandable format.
Turning Data into Action
Raw data rarely provides clear guidance on what actions to take. Generative AI fills this gap by generating actionable insights. It identifies patterns, & anomalies, and recommends steps to address issues or capitalize on opportunities.
Contextualization
Generative AI excels at adding context to data, making it more understandable and relevant. It interprets the significance of data points, a task often challenging for humans when dealing with raw information.
Wrapping Up
In the current scenario, observability stands as a critical and practical approach for understanding the complexities of modern network systems. With the advent of containerization, microservices, and cloud technologies, systems have become more intricate. Observability, as an evolving field, is set to grow alongside these advancements, enhancing data integration, and task automation, and bolstering defenses against cyber threats and legal breaches.
Moreover, the implementation of novel technologies like operational data fabric and generative AI in observability strategies empowers organizations to harness the full potential of their data, facilitating a comprehensive, hybrid multi-cloud approach.
Furthermore, what puts Apica at the forefront of the observability race is its status as the first data fabric to offer a Generative AI assistant. The integration into Apica’s Ascent platform marks a major advancement in data analysis and efficiency.
Ultimately, the evolution in observability equips software professionals with a data-centric methodology throughout the software lifecycle, unifying various forms of telemetry into a singular platform. Such integration fosters and will contribute to the development, deployment, and management of exceptional software, driving innovation and progress all in all.
In a Glimpse
- Observability, once seen as advanced monitoring, is now as crucial as IT security.
- Faces issues like complexity, cost, data overload, but essential in software deployment.
- Understanding systems from external data; includes logs, metrics, traces, and more.
- Monitoring uses predefined metrics; observability offers a deeper, data-driven understanding.
- Originated from control theory in the 1950s, applied in computing since the 1990s.
- Enhanced system understanding, problem detection, and proactive management.
- Observability is to DevOps what a compass is to Navigation.
- Includes AI, distributed tracing, Kubernetes, and more.
- Addresses observability complexities, especially in hybrid multi-cloud systems.
- Automates analysis, enhances decision-making, and adds efficiency.
- First to offer Generative AI in observability, enhancing data analysis and efficiency.

