Distributed tracing enhances observability by providing detailed insights into the performance, behavior, and dependencies of your distributed system. It empowers you to proactively identify and resolve issues, optimize performance, and deliver a reliable and high-performing application.
That being said, distributed tracing via OpenTelemetry enhances observability by providing a detailed understanding of your application’s performance, facilitating efficient troubleshooting, and enabling proactive performance optimization.
However, Traces generated by OpenTelemetry can quickly accumulate and reach significant volumes.apica.io plays a crucial role in visualizing the generated data and providing analytical tools and views that help users derive valuable insights.
By leveraging Apica’s capabilities, you can make sense of the incoming data, easily pinpoint the root causes of issues, and even predict potential outcomes. In short, Apica serves as a powerful ally in making the most of your distributed tracing data.
In this article, we’ll showcase the process of integrating Distributed Tracing with MuleSoft APIs using OpenTelemetry.
But before we delve into the integration, let’s take a moment to provide you with a brief overview of the MuleSoft and Apica platforms.
Active Observability with Apica
The Apica suite comprises three robust products: Observe, Flow, and Lake.
Let’s explore each one briefly.
1. Observe: Real-time Visibility and Analysis
Observe provides Active observability, enabling easy monitoring and analysis of your entire tech stack’s performance and health. With real-time visibility into your entire business, from the customer-facing front end to the supporting back-end systems, Observe allows you to identify and prioritize issues impacting your bottom line effectively.
2. Flow: Seamless Data Aggregation and Analysis
Flow empowers you to gain pipeline control by aggregating, analyzing, and displaying data from any source with seamless scalability. With Flow, you achieve data reliability, management, and governance at scale, enabling informed decision-making based on accurate and comprehensive data.
3. Lake: Unified Data Integration and Insights
Lake focuses on compliance and search. It seamlessly integrates data from diverse sources, providing a unified view of your entire data ecosystem. Lake aids in reducing data size and significantly decreasing the time required to gain valuable insights, even when dealing with large-scale data sets.
How It Works
At its core, the Apica system can take data from any source and seamlessly store, analyze, transform, and connect it to any destination. This includes popular data storage solutions that you might be using for compliance purposes.
Our platform not only improves data visibility and analysis but also enhances your data retention capabilities. You can retain larger amounts of data for longer periods, all while significantly reducing costs.
Moreover, Apica brings active observability when you need it the most. From synthetic monitoring and load testing to tracing issues deep within your backend services, Apica’s monitoring platform enables real-time centralized observability.
Not to mention that by embracing OpenTelemetry, we can easily connect and integrate with various environments, ensuring a seamless integration experience.
With Apica, you can trace a synthetic check all the way back to a backend service, providing complete visibility into the code and data flows. This makes it effortless to identify and resolve challenging scenarios, even when they seem like finding a needle in a haystack.
MuleSoft Integration for Distributed Tracing
Let’s quickly understand the purpose of the MuleSoft platform before we look into the integration process.
MuleSoft serves as a robust integration platform that facilitates seamless connections between diverse systems, applications, and data sources. It functions as a skilled conductor in an orchestra, harmoniously bringing together different elements to create a symphony of integration.
Furthermore, MuleSoft provides interfaces that we can employ to effectively monitor events occurring within the running Mule application.
For instance, we can implement the MessageProcessorNotificationListener, which enables us to listen for notifications when Mule processors start and end. By leveraging the capabilities of OpenTelemetry APIs, we can create and establish connections between spans.
By combining the implementation of MuleSoft’s notification listeners with the power of OpenTelemetry APIs, we can successfully construct OpenTelemetry-based spans and traces. These valuable data points can then be transmitted to an external analysis tool, facilitating the monitoring of telemetry data and gaining valuable insights.
Screenshot Demonstrations
We’ll be using Anypoint Studio which is Mulesoft’s official IDE for developing Mule applications.
We’ll be using Anypoint Studio to develop a mule app that integrates MuleSoft APIs with Amazon Services.
We’ll then use Apica’s observability tools to export these traces in order to further analyze, and visualize data and root-cause issues.
The Mulesoft pipeline uses AWS services (S3 and SQS) and exports Traces to Apica using the OpenTelemetry protocol.
Just to specify, S3 Puts an object in a bucket, while SQS Sends a sample message in the Queue service.
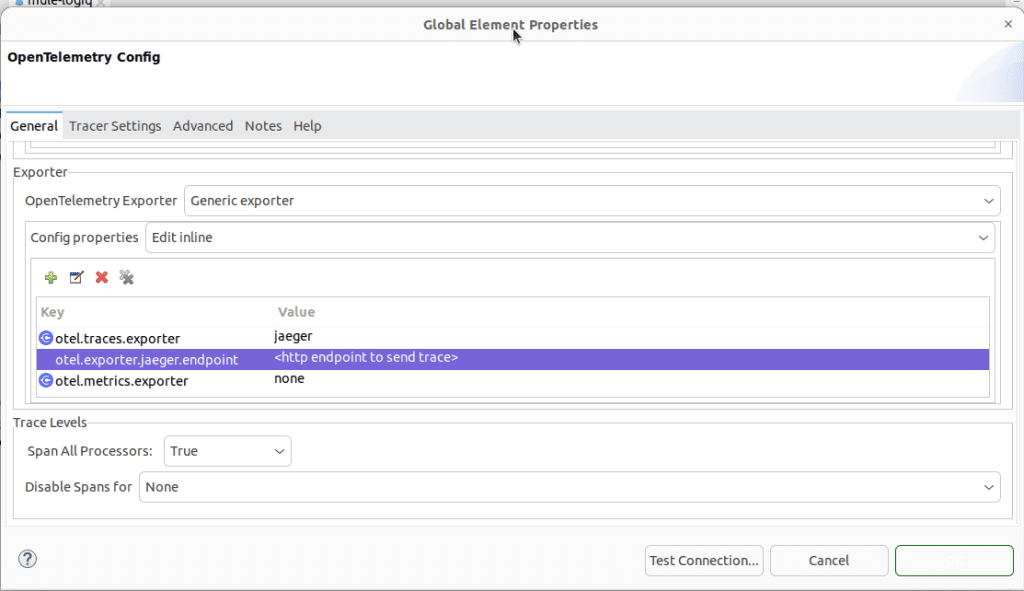
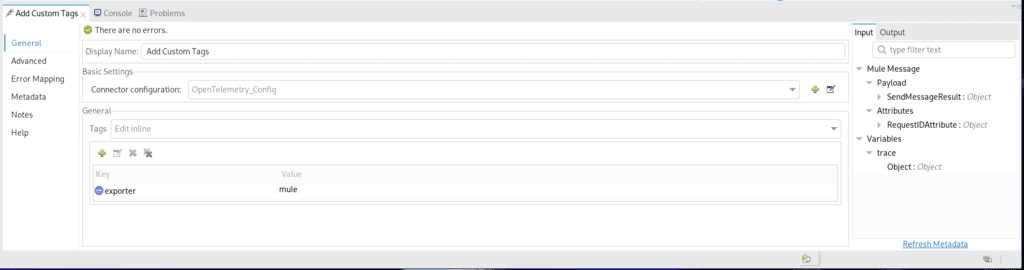
Here’s the OpenTelemetry Configuration to enable sending traces to Apica. You can see the Key-value pairs highlighted in purple.
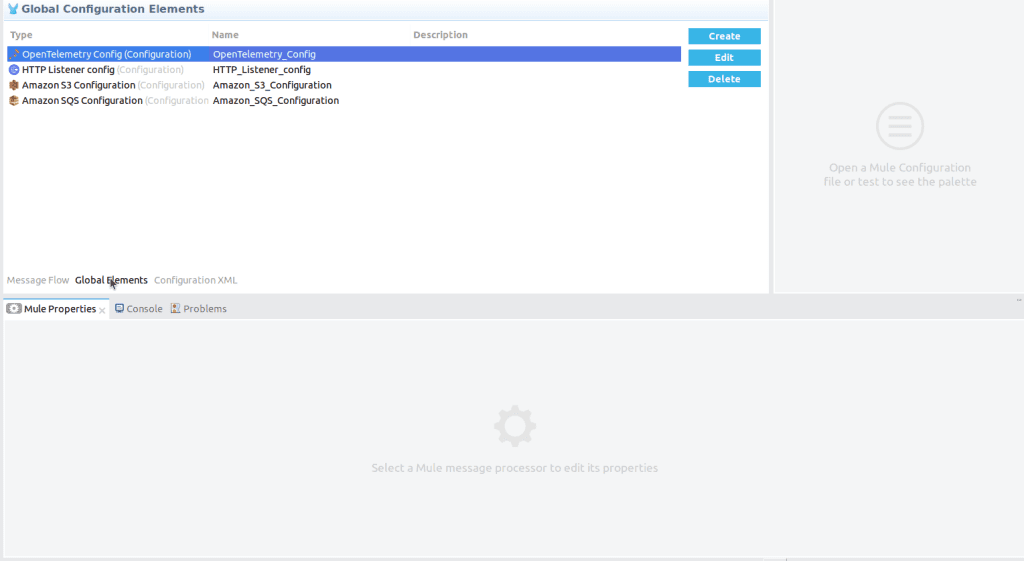
This is the Global Configuration in Anypoint Studio for OpenTelemetry.
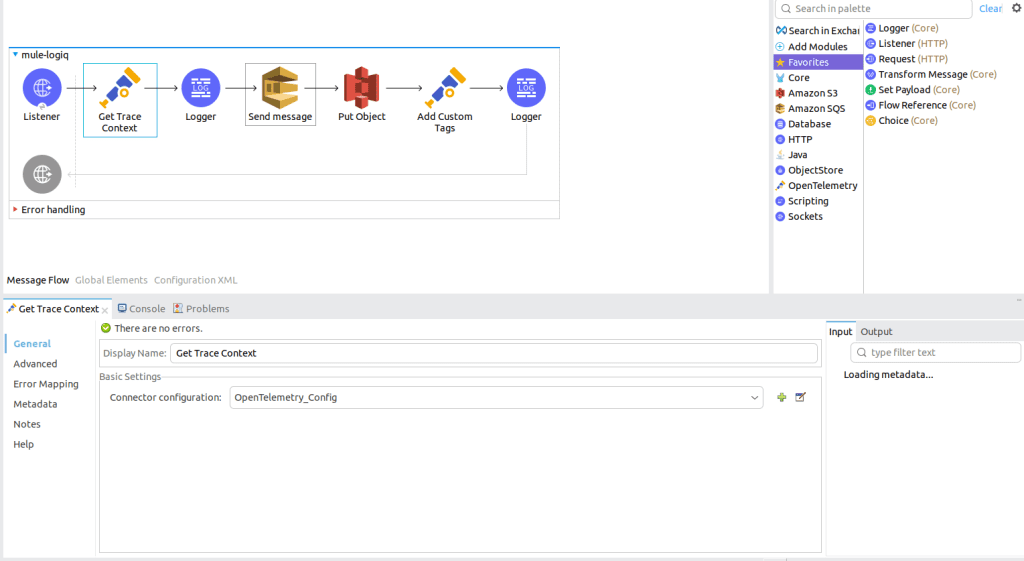
the Mulesoft pipeline that uses AWS services (S3, SQS, and Lambda) and exports Traces to Apica using the OpenTelemetry protocol.
The mule-send-Apica and the mule-receive-Apica are the two Flows in Anypoint Studio that demonstrate the integration between Mule and AWS and also demonstrate the integration between the entire app and Apica.
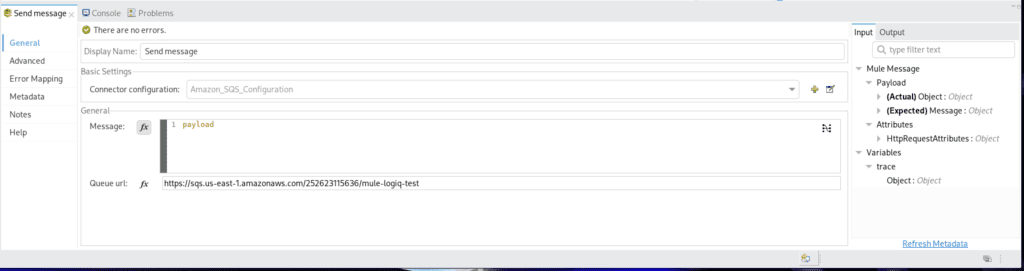
The first flow is responsible for sending events received from a sample HTTP server to Amazon SQS for further processing.
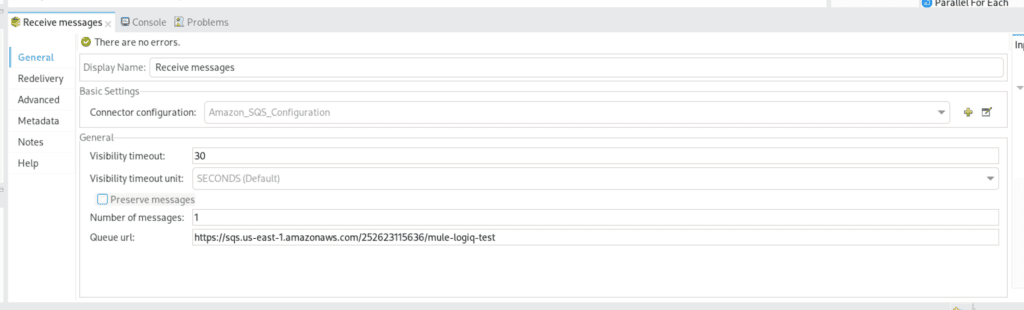
The Second Flow is responsible for receiving events from the first flow and doing some further processing on it, which includes:
a) Invoking a remote lambda function, that is to say, getting the return from the function and
b) using the return from the lambda function and putting an object in Amazon S3 Storage
To configure the Transform Message step in the first flow, we get the trace context from the previous step and send that in the body of the sqs message.
Note that you need to Transform Step, to transform the message and format it the way SQS wants it.
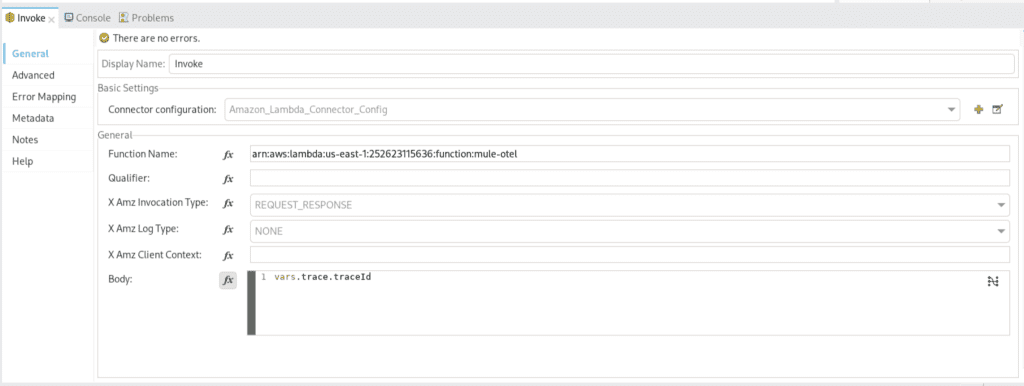
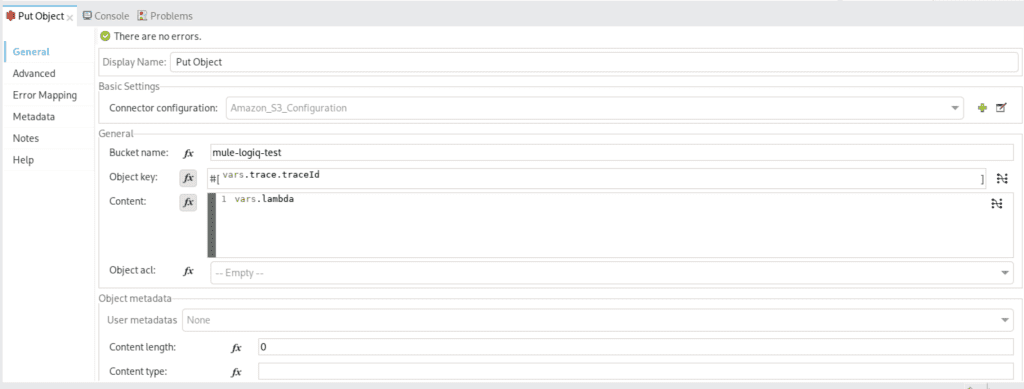
We store the contents retrieved from the lambda function and put it as an object.
The object will have the value from the lambda response whereas the object key will be the traceID of the entire trace.
In the Apica Distributed Tracing Main Page. This is where you’ll find an overview of your traces and can drill down into specific details.
Furthermore, you have the option to search here based on the Service Name, Operation, Tags, and Duration.
Not to mention that you can also limit the number of results returned.
Conclusion
In summary, Apica’s integration with MuleSoft APIs using OpenTelemetry for Distributed Tracing offers comprehensive insights into your application’s performance.
Apica’s active observability and OpenTelemetry’s powerful tracing capabilities enable you to gain comprehensive insights into your application’s performance and easily identify and resolve issues.
In a Glimpse
- MuleSoft serves as a powerful integration platform, bringing together different systems, applications, and data sources seamlessly.
- MuleSoft interfaces, such as MessageProcessorNotificationListener, combined with OpenTelemetry APIs, facilitate the creation and linking of spans for building OpenTelemetry-based traces.
- Integration between Apica and MuleSoft using OpenTelemetry enables the monitoring of telemetry data for comprehensive insights and issue resolution.
- Apica’s integration with MuleSoft APIs using OpenTelemetry enhances observability, allowing comprehensive insights and efficient issue resolution.


