In the previous article, we talked about Distributed Tracing with MuleSoft APIs using OpenTelemetry.
In this post, we’ll go through the process of integrating Distributed Tracing with MuleSoft APIs using OpenTelemetry via a proxy server.
The purpose of this article is to demonstrate how we can instrument a legacy mule app with open telemetry without making changes to the existing app.
Here, we’re showing an example of getting data from a header as well as a query parameter.
But before we dive into it, let’s take a moment to provide you with a brief overview of what the proxy server is about.
Understanding the Proxy Server
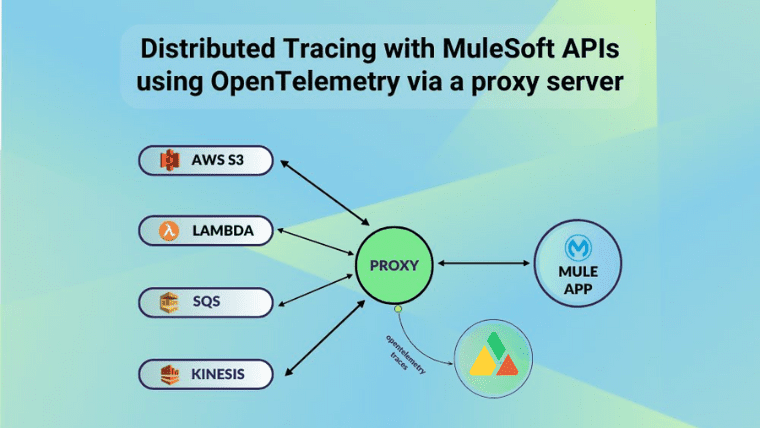
The Proxy Server acts as an intermediary between the MuleSoft APIs and the external services.
What this means is that it can handle both HTTP and HTTPS requests, enabling tracing over both protocols.
In addition to that, it captures various request details like URLs, Headers, Cookies, Query Params, and RequestURI.
Furthermore, Spans can be grouped under one trace if they share the same ApicaID.
The Proxy Server is essentially responsible for assembling all the spans and exporting them to Apica.
The main advantage of using this method is that it easily allows us to instrument mule applications without any changes in the codebase.
This is highly beneficial for legacy mule applications.
Apica Overview
The Proxy Server acts as an intermediary between the MuleSoft APIs and the external services.
What this means is that it can handle both HTTP and HTTPS requests, enabling tracing over both protocols.
In addition to that, it captures various request details like URLs, Headers, Cookies, Query Params, and RequestURI.
Furthermore, Spans can be grouped under one trace if they share the same ApicaID.
The Proxy Server is essentially responsible for assembling all the spans and exporting them to Apica.
The main advantage of using this method is that it easily allows us to instrument mule applications without any changes in the codebase.
This is highly beneficial for legacy mule applications.
MuleSoft Integration for Distributed Tracing
Let’s quickly understand the purpose of the MuleSoft platform before we look into the integration process.
MuleSoft serves as a robust integration platform that facilitates seamless connections between diverse systems, applications, and data sources. It functions as a skilled conductor in an orchestra, harmoniously bringing together different elements to create a symphony of integration.
Furthermore, MuleSoft provides interfaces that we can employ to effectively monitor events occurring within the running Mule application.
For instance, we can implement the MessageProcessorNotificationListener, which enables us to listen for notifications when Mule processors start and end. By leveraging the capabilities of OpenTelemetry APIs, we can create and establish connections between spans.
By combining the implementation of MuleSoft’s notification listeners with the power of OpenTelemetry APIs, we can successfully construct OpenTelemetry-based spans and traces. These valuable data points can then be transmitted to an external analysis tool, facilitating the monitoring of telemetry data and gaining valuable insights.
Screenshot Demonstrations
We’ll be using Anypoint Studio to develop a mule app that integrates MuleSoft APIs with Amazon Services.
We’ll then use Apica’s observability tools to export these traces in order to further analyze, and visualize data and root-cause issues.
Firstly, we’ll have to see how to handle the instrumentation of the traces. We will point our mulesoft application to talk to aws services via our proxy service which will automatically instrument our mule application.
Simply put, all requests from MuleSoft APIs are proxied through the Proxy Server, which handles the instrumentation for traces.
The Mulesoft pipeline uses AWS services (S3 and SQS) and exports Traces to Apica using the OpenTelemetry protocol.
Just to specify, S3 Puts an object in a bucket, while SQS Sends a sample message in the Queue service.
The Mulesoft app cannot be changed to add opentelemetry but we want to still be able to extract and integrate with open telemetry. The Apica mulesoft opentelemetry proxy becomes a handy tool for this.
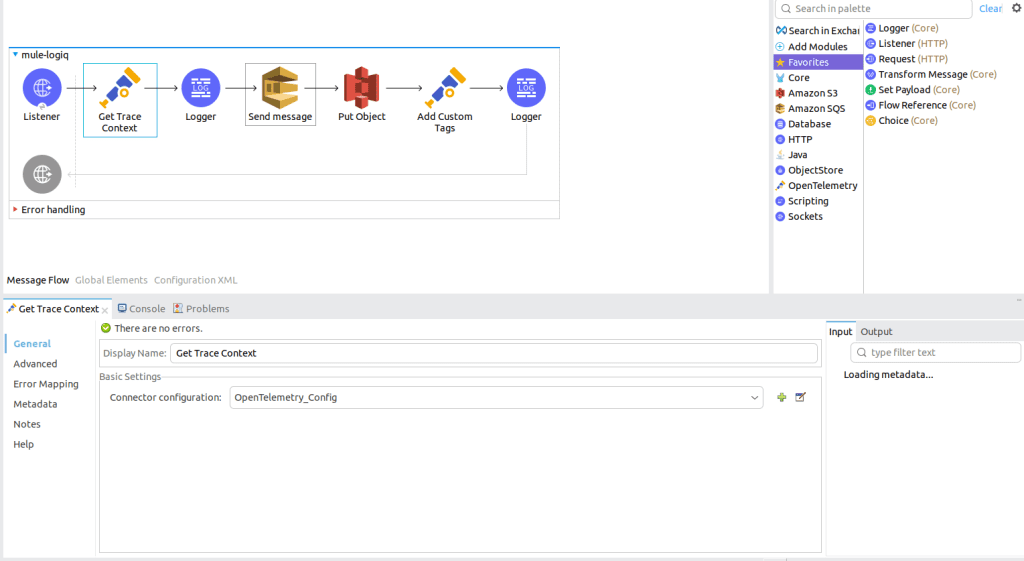
The mule-send-Apica and the mule-receive-Apica are the two Flows in Anypoint Studio that demonstrate the integration between Mule and AWS and also demonstrate the integration between the entire app and Apica.
The first flow is responsible for sending events received from a sample HTTP server to Amazon SQS for further processing.
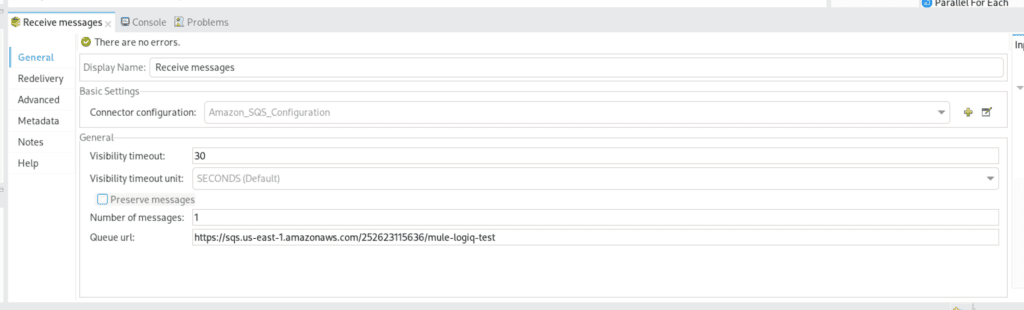
The Second Flow is responsible for receiving events from the first flow and doing some further processing on it, which includes:
a) Invoking a remote lambda function, that is to say, getting the return from the function and
b) using the return from the lambda function and putting an object in Amazon S3 Storage
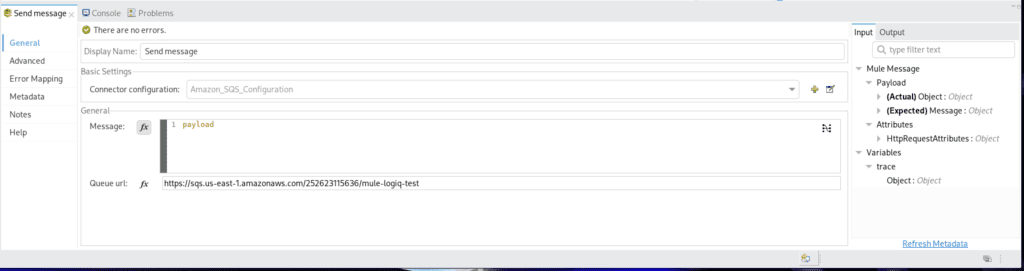
To configure the Transform Message step in the first flow, we get the trace context from the previous step and send that in the body of the sqs message.
Note that you need to Transform Step, to transform the message and format it the way SQS wants it.
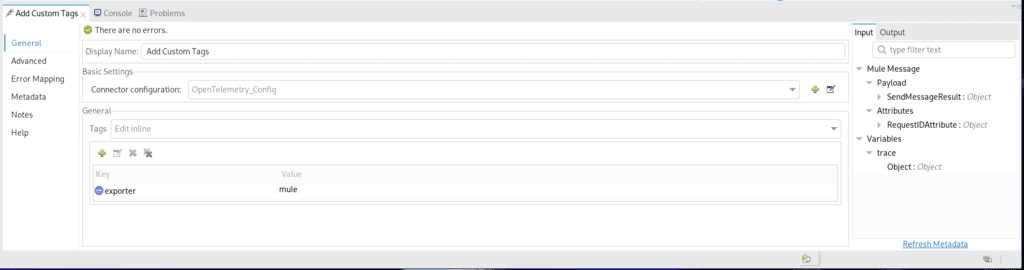
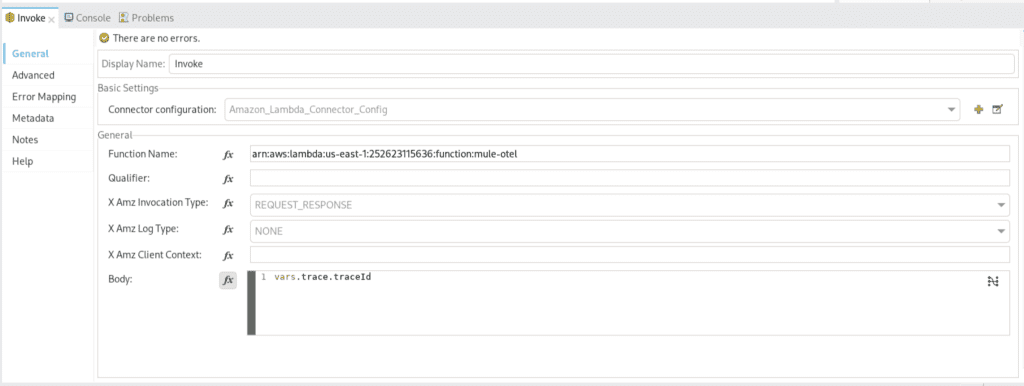
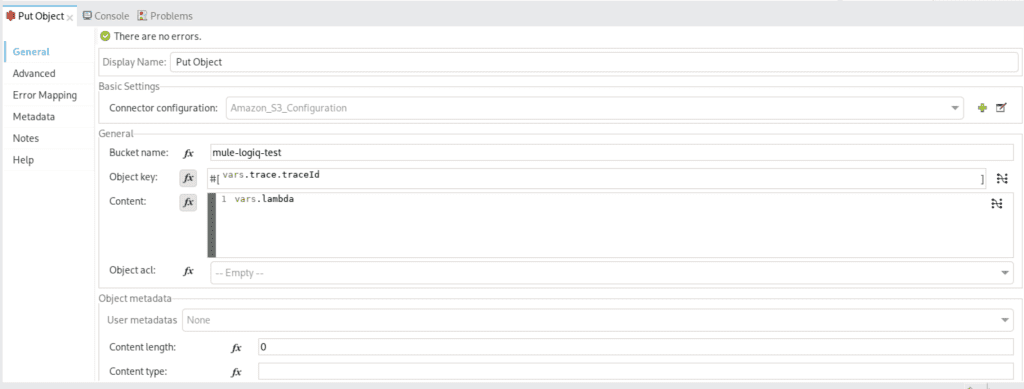
The object will have the value from the lambda response whereas the object key will be the traceID of the entire trace.
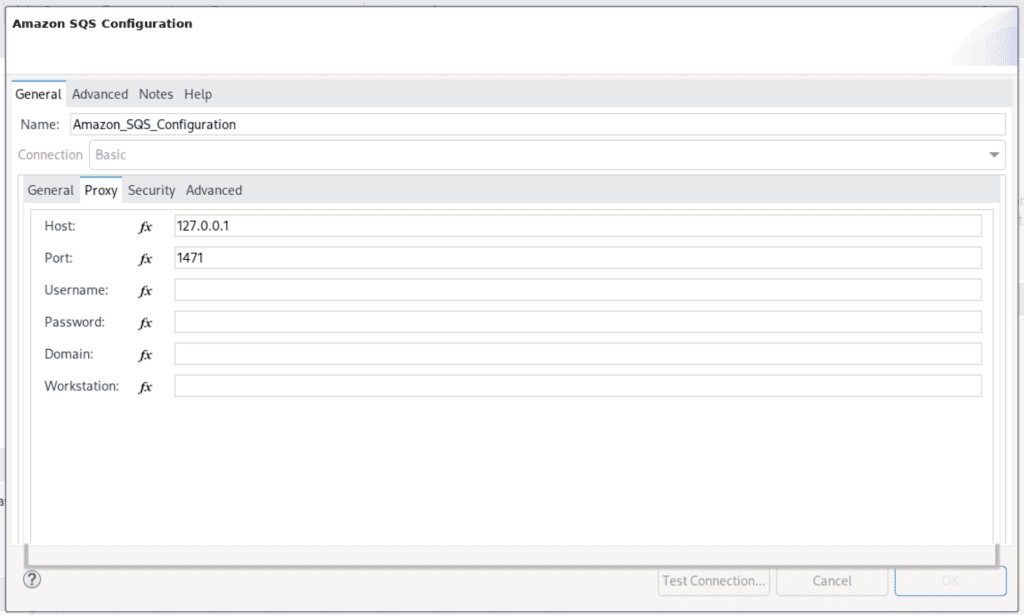
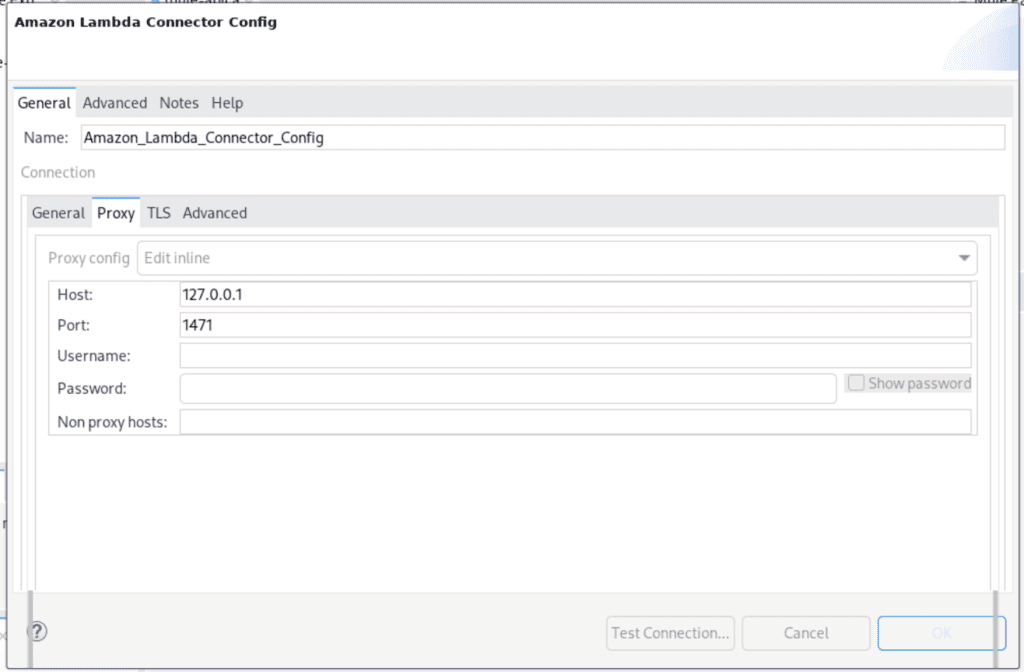
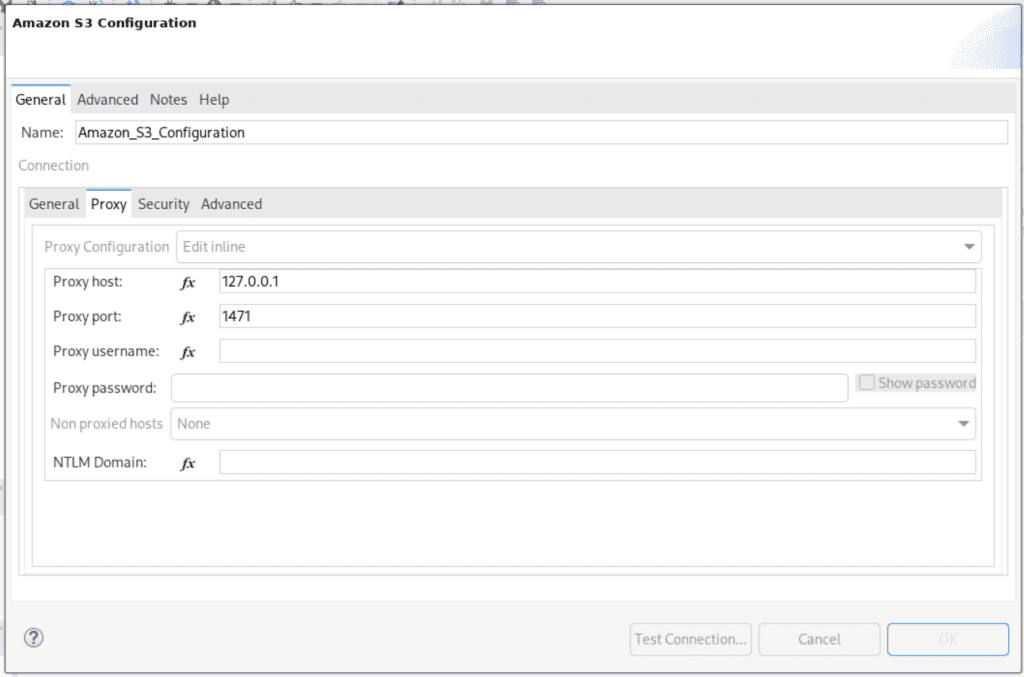
We store the contents retrieved from the lambda function and put it as an object. This is the proxy configuration to route requests through our proxy server.
We are all set now. The proxy now intercepts all AWS API calls made by the Mulesoft application, uses the trace identifier, and stickers the API flows into a single trace. The proxy can extract data from the request header, URL, and query parameters. The constructed open telemetry spans are then sent to Apica while forwarding the traffic to AWS APIs in real-time.
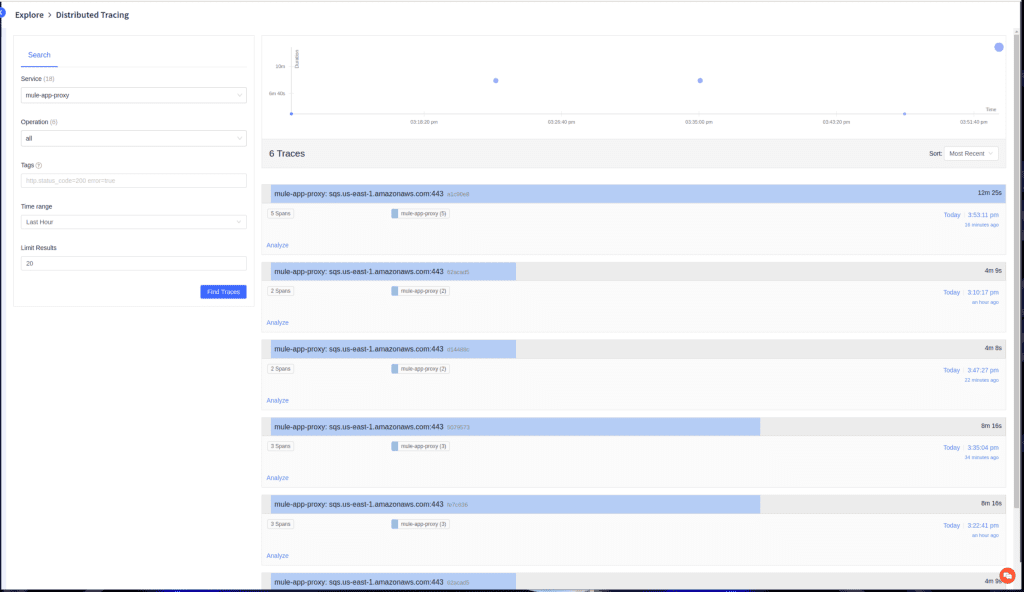
In the apica.io Distributed Tracing Main Page. This is where you’ll find an overview of your traces and can drill down into specific details.
Furthermore, you have the option to search here based on the Service Name, Operation, Tags, and Duration.
Not to mention that you can also limit the number of results returned.
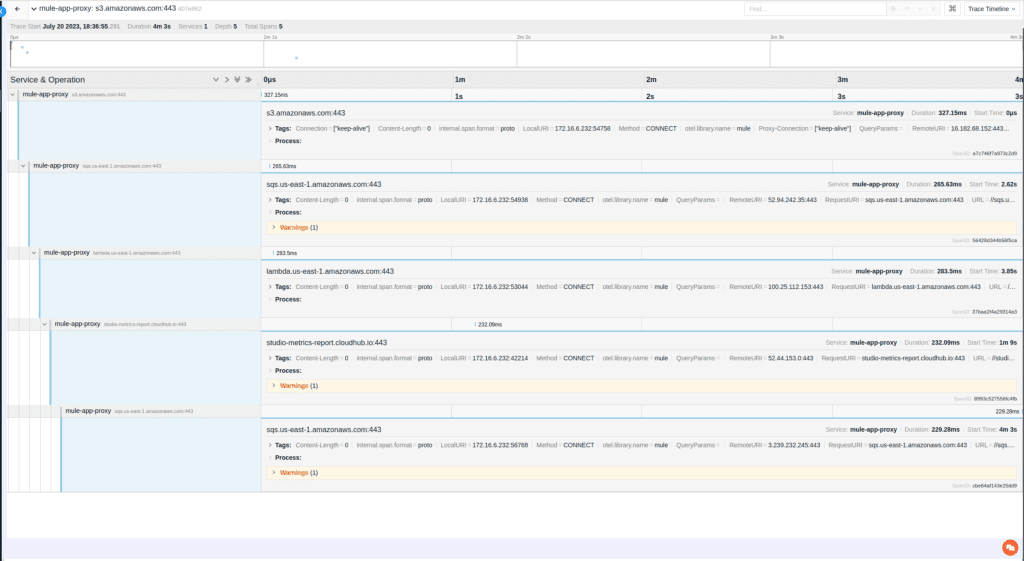
Here, we have some Sample Trace returned from a Mule app through our proxy server, showcasing a typical trace flow. We have grouped spans to signify the same context here according to the same ApicaID.
Note that, this also highlights the tags that we have extracted from the request like URL, headers, params, etc.
Conclusion
We’ve delved into the world of Distributed Tracing with MuleSoft APIs using OpenTelemetry and learned how to implement it via a proxy server.
The primary purpose of this article was to demonstrate a seamless approach to integrating OpenTelemetry into a legacy Mule app without having to modify the existing codebase.
By employing the proxy server, we can efficiently capture essential tracing data without disrupting the app’s current functionality.
Throughout the post, I provided a practical example, illustrating how to extract data from both headers and query parameters.
Now equipped with a clear understanding of the proxy server’s role, you can confidently incorporate Distributed Tracing into your MuleSoft projects, enhancing observability and enabling effective performance analysis.
In a Glimpse
- MuleSoft serves as a powerful integration platform, bringing together different systems, applications, and data sources seamlessly.
- MuleSoft interfaces, such as MessageProcessorNotificationListener, combined with OpenTelemetry APIs, facilitate the creation and linking of spans for building OpenTelemetry-based traces.
- Integration between Apica and MuleSoft using OpenTelemetry enables the monitoring of telemetry data for comprehensive insights and issue resolution.
- Apica’s integration with MuleSoft APIs using OpenTelemetry enhances observability, allowing comprehensive insights and efficient issue resolution.


