
Prometheus is a wildly deployed open source monitoring system for time series metrics. For observability use cases, it is important to bring together logs and metrics for root cause analysis into a tightly integrated framework to help faster root cause.
A Prometheus deployment is configured with scrape targets from which metrics are collected periodically. The data is stored in a multi-dimensional data model with metric data stored along with a set of key-value pairs, commonly referred to as labels. This allows data query by one or more dimensions as well as perform aggregate queries such as rate/sum etc. Here’s an example of how a multi-dimensional query looks like in Prometheus
round(sum(increase(message_count{application="ingress"}[30d]))/1000000,0.01)In the above query, the message_count metric is filtering data by the label/dimension application
Log data tends to be mostly unstructured with some amount of structured payload added by agents and collectors. When an interesting event occurs in the log, one possible workflow is to record it as a metric in Prometheus. This brings logs and metrics together. This can serve as a powerful way to visualize what is happening in your logs. Extracted data from your logs can become labels making dimensional queries possible.
Let’s take an example where we want to visualize when invalid ssh logins are printed in my logs for the sshd process running on Linux instances. This can be very useful as we could then proceed to set up Prometheus and Alertmanager alerting rules if the invalid logins exceed a certain threshold in a 5-minute interval. This could signal an impending attack on our infrastructure.
This requires a simple regex rule when processing the log line and a Prometheus counter to track when the regex matched. The counter is incremented when that happens.
Sample log : Invalid user cactus from 121.4.86.248 port 60112
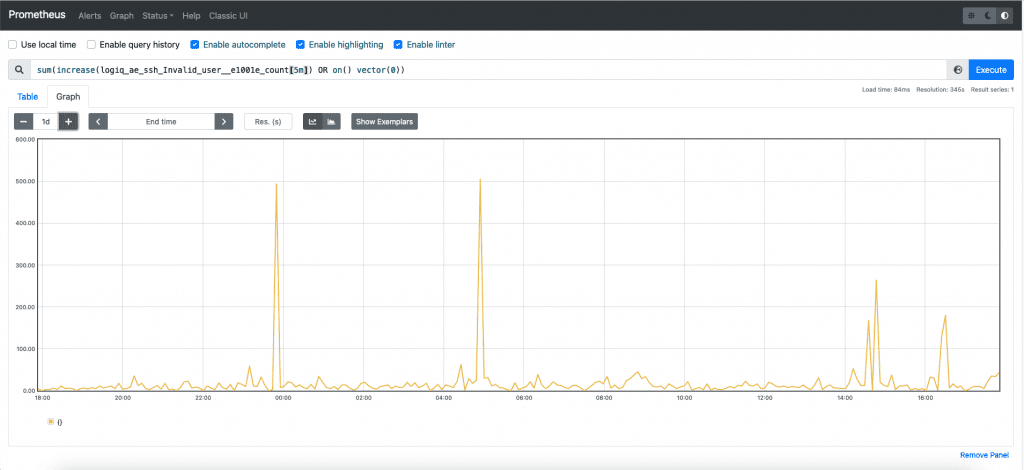
Regex: log =~ "Invalid user"We can then have a Prometheus counter metric that can track such regex matches. Let us see how this looks when we plot the data in Prometheus for an incoming stream. Nice! We can see unexpected spikes as well as what looks normal on our network.
The next step is going from the Prometheus graph back to the actual logs. This can be accomplished if the log stream is tagged with the event whenever a regex match is detected. E.g. in the example above let us see how that would look.
Incoming event

{
"log":"Invalid user cactus from 121.4.86.248 port 60112"
} After the regex match, transforms to  {
"log":"Invalid user cactus from 121.4.86.248 port 60112",
"event": "invalid_ssh_event"
}
The transformed event can now be indexed with your log system to go from logs -> metric -> logs. The metric allows you to now set alerts as well while being able to search when the events happened using the event key-value pair.
As you can see it is now simple to do root cause analysis using logs, Prometheus, and a bit of coding. Alternately if you want to try an integrated version of this flow in the apica.io platform, just get started with a FREE Trial and we can help you get started.
Let’s now see this in action with the apica.io platform where we have done the integration for you to go from logs to metrics and back to logs.
apica.io’s LogFlow platform allows real-time insights into your data flows as they flow into downstream systems like Splunk, Datadog, etc. Valuable insights can be tagged into data streams so when the data hits the target platform, it is tagged with labels that can assist and speed up root cause analysis in such systems.
Bringing together log data and APM data from Prometheus / Thanos fills a key gap where users frequently need to look at interesting events in their environment in an aggregated way as a time series graph but need to switch over to log/trace view where the actual event can be seen. This can help with reducing the time to triage that is common when these two data streams are disjoint.