Monitoring application performance is more important than ever. With an ever-growing catalog of applications in need of support, and IT architecture increasing in complexity, ensuring the ideal user experience is a tremendous challenge. Traditional performance monitoring solutions have limited visibility and can’t keep up with evolving enterprise needs to ensure SLAs are met.
The digital performance platform from Apica combines load testing and application performance monitoring for full transactional visibility from end to end. See what users have to say about Apica’s synthetic monitoring capabilities, from PeerSpot.
As Joseph F., an Information Systems Engineer III at a financial services firm with over 1,000 employees, explained, “We started with SolarWinds, and after that, we moved to Apica. We then got rid of our SolarWinds integration and went to LogicMonitor. However, the problem with LogicMonitor’s website monitoring tools is that it’s very hard to set up a script the way that Apica does.” In his view, LogicMonitor also did not provide screenshots of what happened. He remarked, “We’ve looked at a number of other vendors as well. The problem always comes down to, it doesn’t do the things that Apica does.”
Shafi M. a Lead Consultant on the Engineering Team at an Insurance Giant said “With Catchpoint, the con was the flexibility in terms of working through enhancements and changes. It was not flexible enough to accommodate the changes. The scripting engine for Apica is very flexible, which was another major con from the other tools that we evaluated. In Apica, I can write my own custom code, which I can’t do in the other tools. This was a big pro for Apica when we were making our decision.”
For Nick M., CTO of GreySnowPoker, a gaming company, regional presence was a big factor. He switched from NCC Group (now Eggplant Monitoring) because, as he put it, “We saw the ability of Apica’s product. I did quite a bit of research at the time. The main differences for NCC Group at the time were they didn’t have different regional pops nor did they have the coverage that Apica has. They have locations all around the world. Having all the locations around the world is very useful, especially when you’re in a license market.”
Deriving Digital Performance Value
PeerSpot members found value in Apica Synthetic across multiple areas of APM. For instance, According to Nick M, Apica’s scripting abilities were what stood out to him. He said, “For a QA person, it is very easy because they have the understanding of the tools and what they have to offer. From the complexity side, it is very possible to do pretty much everything on Apica: down to logging in and up deposit, doing other processes inside your website, and loading slot machines to make sure external providers are loading correctly.”
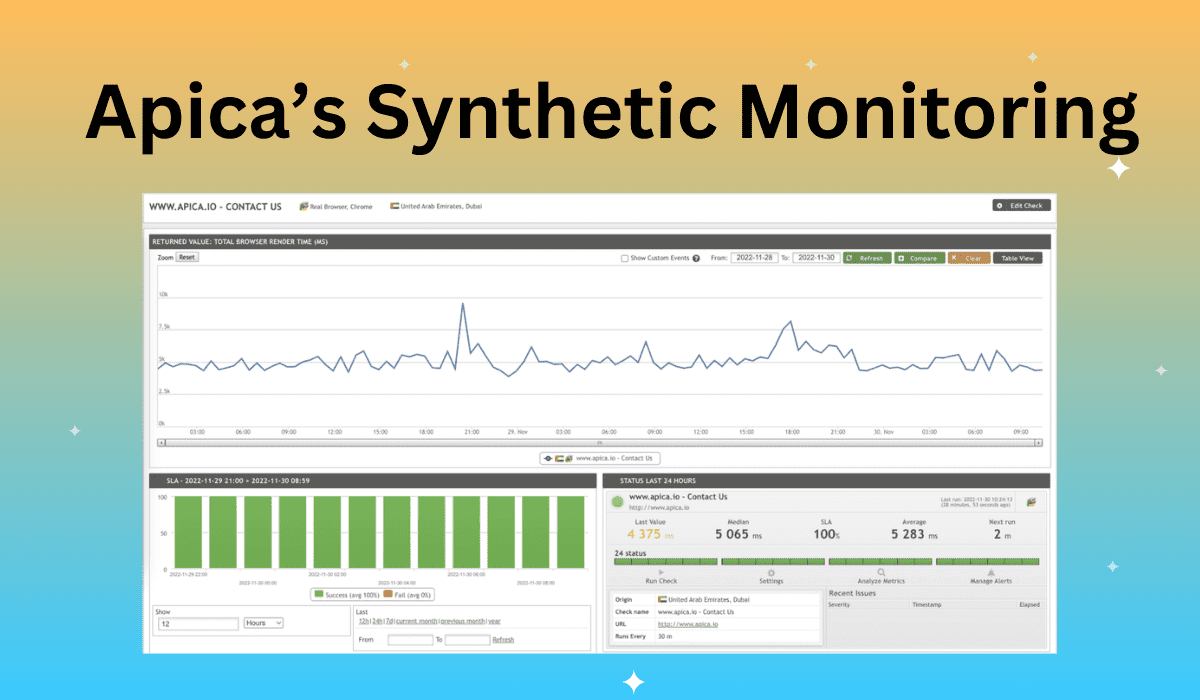
“The WebHooks are obviously really great,” said Greg A., an IT Director at a financial services firm with more than 5,000 employees. He added, “The alert framework is really good and then the reporting and visualizations that you get from the dashboards are good. The dashboard view tells you the health of the services that we have monitored, and how the health of the entire infrastructure is doing at a glance. From an operational standpoint, I would say that it’s at least improved our monitoring efficiency by 5% to 10%.”
Other notable comments about solution value included:
- “The tool is flexible to handle multiple complex scenarios, which is one of the good things that led us to decide on Apica.” – Shafi M., a Lead Consultant, Engineering Team at an insurance company with over 10,000 employees
- “We like the scripting features and the scenarios. It allows us to set up exactly how a customer would log in, what they would type in, where they would click on the screen, and then take screenshots of it so that we can actually see it happen and see what they see at that time.” – Joseph F.
- “The flexibility of the solution in terms of the range of protocols it can monitor has been great. The product has been working as expected and it has helped us to cover something like 95 percent of the outages or issues that we have had.” – Basma A., an IT Operation Lead at a comms service provider with more than 500 employees
Apica helps with digital performance monitoring
ITCS ReviewApica users also discussed how the solution helped them with their application monitoring workloads. As Nick M explained, “Accuracy is probably around 98 percent. It helps with releases because we monitor them in staging. We can tell if something is critically wrong before it gets into production, e.g., if it was load related or function related and also what was different in the dev stage. It then alerts us straightaway inside of our production monitors once it has been released. Therefore, it has improved how we run our systems since we monitor multiple environments.”
For Greg A, the benefit came from having a clear line of sight into when the organization is actually having an external network event that’s affecting its end users. His team is also finding that Apica helps with URL based monitoring that catches expired certificates as well as encryption changes that have an impact on end-users’ ability to access the environment.
Getting to a hybrid model, with the orchestration engine in the cloud and their agents on-premises is an advantage for Shafi M. As he noted, “That has changed the way that we have our load testing and synthetic monitoring setup at this point. Previously, it was always internal. Now, with this change, we can test and run checks from anywhere across the globe.” Basma A similarly found Apica’s multiple deployment options to be helpful in enabling his organization meet its security requirements.
>> Read more about Apica on our page on PeerSpot.


