


AWS CloudWatch is an observability and monitoring service that provides you with actionable insights to monitor your applications, stay on top of performance changes, and optimize resource utilization while providing a centralized view of operational health. AWS CloudWatch collects operational data of your AWS resources, applications, and services running on AWS and on-prem servers in the form of logs, metrics, and events. CloudWatch then uses this data to help detect and troubleshoot issues and errors in your environments, visualize logs and metrics, set up and take automated actions, and uncover insights that help keep your applications and deployments running smoothly.
AWS CloudWatch provides excellent observability for your applications and infrastructure hosted on AWS. But what about your applications and resources hosted on service providers? While you can stream their logs into CloudWatch using proxies and exporters, it isn’t that straightforward. You’d have to monitor them separately using a your service provider’s own monitoring tool or build something in-house using Prometheus or Grafana, maybe. Why train your eyes to watch multiple monitoring tools when you can centralize monitoring and observability across your on-premise servers and cloud providers with Apica? Apica plugs into numerous data sources to centralize your logs and visualize them in a single pane regardless of the service provider.
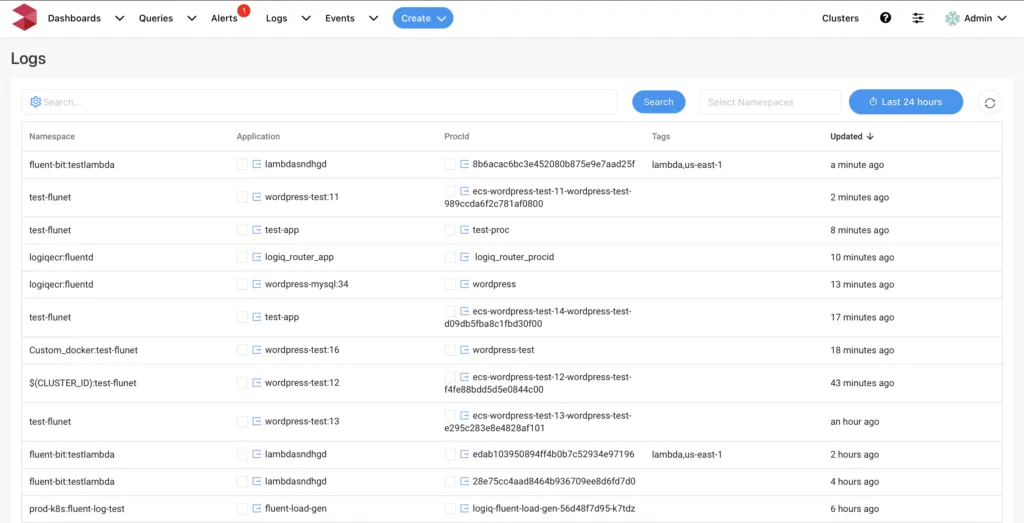
You can easily stream your AWS CloudWatch logs into Apica, thereby letting you monitor your AWS resources applications along with everything else you’re watching with Apica. You can also visualise and analyse your AWS CloudWatch logs in real-time and gain powerful insights into their performance and security.
This guide will show you how you can stream your AWS CloudWatch logs into Apica in no time.
Apica’s AWS CloudWatch Exporter Lambda function
Since we love keeping it simple at Apica, we’ve built an AWS Lambda function that enables you to export your CloudWatch logs to your Apica instance. This AWS Lambda function acts as a trigger for a CloudWatch log stream.

Creating the Apica CloudWatch Exporter Lambda Function
You can create the Apica CloudWatch Exporter Lambda Function using the CloudFormation template available at https://Apicacf.s3.amazonaws.com/cloudwatch-exporter/cf.yaml.
Note: Alternatively, you can also use the code available in our client integrations Bitbucket repository to create the Lambda function.
This CloudFormation template creates a Lambda function along with the permissions it needs. Before using this template, you’ll need to configure the following attributes:
| Parameter | Description |
APPNAME |
A readable application name for Apica to partition logs by. |
CLUSTERID |
A Cluster ID for Apica to partition logs by. |
NAMESPACE |
A namespace for Apica to partition logs by. |
ApicaHOST |
IP address or hostname of your Apica instance. |
INGESTTOKEN |
JWT token to securely ingest logs into Apica |
Creating and configuring the CloudWatch trigger
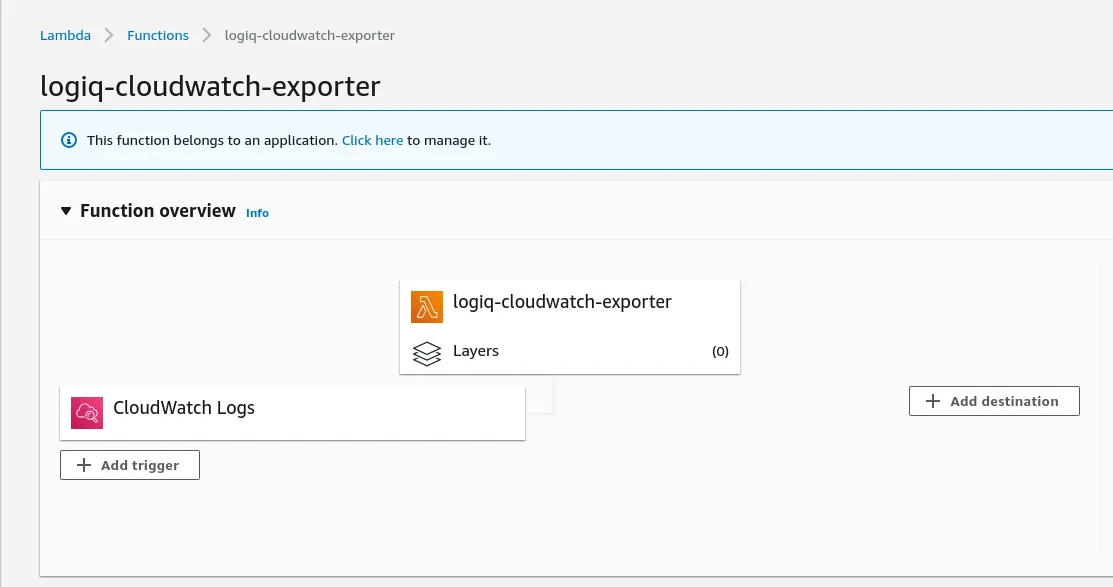
Once you’ve created the AWS Lambda function, it’s time to create and configure the CloudWatch trigger. On your AWS dashboard, do the following:
- Navigate to the AWS Lambda function you just created (Apica-cloudwatch-exporter).
- Click Add Trigger.

- On the Add Trigger page, select CloudWatch Logs.
- Next, select the Log group you’d like to stream to Apica.
- Enter a Filter name and optionally add a Filter pattern.


And that’s it! All new logs from the CloudWatch log group you configured are streamed directly to your Apica instance.
From here, you can easily view, query, visualise and analyse your CloudWatch logs while detecting anomalies in real-time thereby helping you keep your AWS applications and resources always on and performing at their best.