


We’re huge fans of Helm Charts and the simplicity they bring to complex application deployments on Kubernetes and MicroK8s. We showed you how you could use Helm Charts to deploy Apica on MicroK8s in a previous post. As a follow-up to that article, we’d like to show you how Helm Charts are equally helpful in deploying complex applications on other certified Kubernetes distributions such as K3s. In this article, you’ll learn how we use Helm Charts to deploy the Apica observability platform on K3s. If you’ve never used K3s or Helm Charts before, you can use this article to get acquainted with both.
What is K3s?
K3s is a highly available, lightweight, and fully compliant Kubernetes distribution. It is packaged as a single binary, thereby reducing dependencies and minimizing installation, run, and auto-update steps that you’d typically have to take while managing a production Kubernetes cluster. As K3s is lightweight, you can run a cluster on machines with as little as 512 MB RAM and upwards.
K3s comes bundled with a local storage provider, a service load balancer, a Helm controller, and the Traefik ingress controller. A single binary and process encapsulate the operation of all Kubernetes control plane components, allowing K3s to automate and manage complex cluster operations like distributing certificates.
What is Apica?
Apica is a complete observability platform for monitoring, log aggregation, and analytics with an infinite storage scale. Since Apica uses AWS S3 (or S3 compatible storage) as primary storage for data at rest, it allows sending logs from Kubernetes or on-prem servers or cloud virtual machines with ease.
The Apica platform includes:
- A User Interface (UI)
- A command-line toolkit
- A monitoring stack for time-series metrics, and
- A log analytics stack for log data.
Now that we’ve got you acquainted with K3s and Apica, why don’t we jump right into the integration?
Before You Begin
In this tutorial, you’ll learn how to install K3s and then bring up the Apica observability platform on K3s using a Helm Chart. To follow the instructions listed in this article, you’ll need a machine with the Linux OS. You’ll also need the Apica Helm Chart that’s available here: https://artifacthub.io/packages/helm/Apicaai/Apica.
Installing K3s
The first step in this tutorial is the installation of K3s. The most convenient way to install K3s is to install it as a service on systemd or openrc based systems using the following installation script:
curl -sfL https://get.k3s.io | sh -Running this script:
- configures the K3s service to restart automatically after node reboots or process crashes/kills.
- installs additional utilities including
kubectl,crictl,ctr,k3s-killall.sh, andk3s-uninstall.sh. - writes a
kubeconfigfile to/etc/rancher/k3s/k3s.yaml. Thekubectlinstalled by K3s will automatically use this config file.
Now, let’s test your connectivity with kubectl by running the following command:
kubectl get nodesInstalling Apica
Now that we’ve got K3s up and running let’s proceed with installing Apica on K3s.
First, let’s create a namespace called Apica for the stack to spin up from and start running, with the following command:
k3s kubectl create namespace ApicaAnd then run helm install with the storage class set to the local-path as shown below:
helm install Apica -n Apica --set global.persistence.storageClass=local-path Apica-repo/Apica -f values.yaml --debug --timeout 6mNote: The values.yml file used in the command above is customized to suit our cluster’s configuration. You can download the values.yml file from docs.apica.io, edit it to suit your cluster’s needs, and then run the above command.
Creating the K3s Ingress Resources
Traefik is a modern HTTP reverse proxy and load balancer made to deploy microservices with ease. It simplifies networking complexity while designing, deploying, and running applications. Traefik is deployed by default on K3s clusters when starting the server. For more information, see Auto Deploying Manifests. The default Traefik config file is at /var/lib/rancher/k3s/server/manifests/traefik.yaml. Any changes made to this file will automatically be deployed to Kubernetes similar to kubectl apply.
Let’s now edit the configmap for Traefik to enable dashboards that will provide us a birds-eye view of the K3s services by running the following commands:
k3s kubectl -n kube-system edit cm traefik
k3s kubectl  get cm traefik -n kube-system -o yaml
apiVersion: v1
data:
 traefik.toml: |
   # traefik.toml
   logLevel = "info"
   defaultEntryPoints = ["http","https"]
   [entryPoints]
     [entryPoints.http]
     address = ":80"
     compress = true
     [entryPoints.https]
     address = ":443"
     compress = true
       [entryPoints.https.tls]
         [[entryPoints.https.tls.certificates]]
         CertFile = "/ssl/tls.crt"
         KeyFile = "/ssl/tls.key"
     [entryPoints.prometheus]
     address = ":9100"
   [ping]
   entryPoint = "http"
   [kubernetes]
     [kubernetes.ingressEndpoint]
     publishedService = "kube-system/traefik"
   [traefikLog]
     format = "json"
  [api]
     dashboard=true
   [metrics]
     [metrics.prometheus]
       entryPoint = "prometheus"
kind: ConfigMap
metadata:
 annotations:
   meta.helm.sh/release-name: traefik
   meta.helm.sh/release-namespace: kube-system
 creationTimestamp: "2021-02-18T17:01:19Z"
 labels:
   app: traefik
   app.kubernetes.io/managed-by: Helm
   chart: traefik-1.81.0
   heritage: Helm
   release: traefik
 name: traefik
 namespace: kube-system
 resourceVersion: "17882"
 uid: 7c5a6dc6-be44-4957-b666-d9af1fecbdbc
Now, let’s forwards ports to the Traefik dashboard by running the following command:
k3s kubectl -n kube-system port-forward deployment/traefik 8080The Traefik dashboard should now be available http://localhost:8080/dashboard. The Traefik displays all of the back-end services, as shown in the following image:
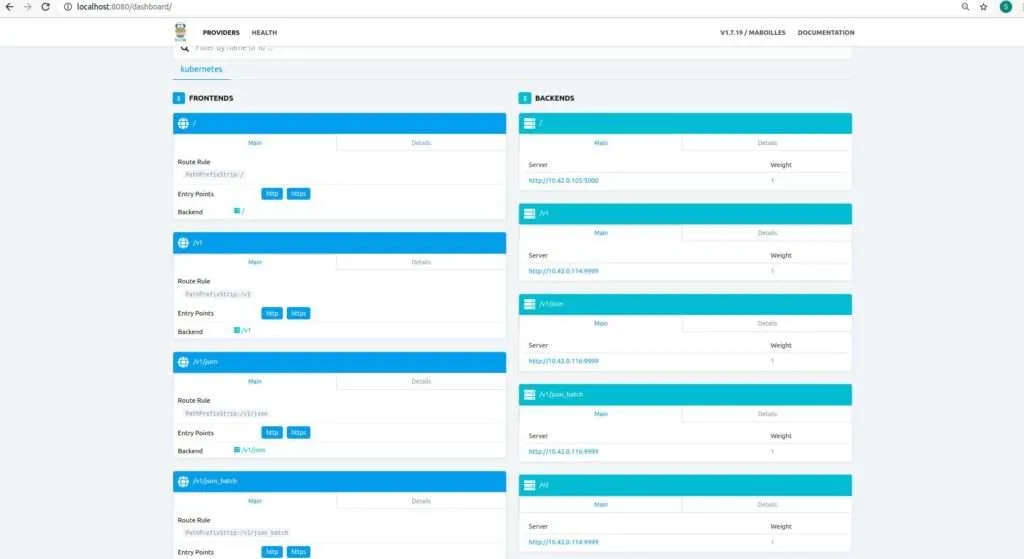
In case your Traefik dashboard fails to load, do try restarting all of your deployment pods.
Bringing up Apica
Let’s now bring up our Apica deployment. The apica.io observability platform serves from port 80. Ensure that no other services are running on port 80 by running the netstat command and killing the service in case you find one running on port 80. Let’s check the IP address where Apica is serving from by running the command:
k3s kubectl get svc -nApica
NAME TYPE CLUSTER-IP EXTERNAL-IP PORT(S)                                                                                           AGE
Apica-kubernetes-ingress LoadBalancer   10.43.132.133   192.168.1.27   80:31245/TCP,20514:31314/TCP,24224:30766/TCP,24225:30349/TCP,0/TCP,8
081:30683/TCP,9998:30891/TCP     3h2m
The output above shows that Apica is serving from IP 192.168.1.27. Now, using your favorite web browser, access http://192.168.1.27:80.
And that’s it! Apica is now up and running on K3s!

As you can see, Helm Charts truly make the deployment of heavy applications a breeze – even on lightweight Kubernetes distributions like K3s. Using Helm Charts on K3s helps you enable your developers to spin up their local Kubernetes development environments without having to worry about the finer details or complexities of configuring and managing a full-fledged Kubernetes cluster. You’ll also notice that the Apica observability platform isn’t infrastructure or resource-heavy. You can keep your monitoring and observability costs at a minimum by running Apica on K3s while still enjoying all of Apica’s goodness that ensure you deliver always-on applications and infrastructure at scale.
