Kubernetes is a go-to solution for most cloud operators when it comes to container orchestration in distributed environments. Kubernetes performs phenomenally well when automating web server provisioning based on traffic, scaling and degrading servers based on demand, and load balancing for routing traffic. But with the level of distribution Kubernetes environments are subjected to these days, it’s now trickier for Kubernetes operators to identify, troubleshoot, and rectify new issues introduced due to the distribution of the environment. Here’s where an airtight Kubernetes monitoring and observability strategy becomes essential.
The evolution of a Kubernetes environment and the addition of newer systems and services introduce more failure points that operators now need to identify and monitor in addition to everything they’re already watching. A typical Kubernetes monitoring setup consists of:
- a distributed tracing system (like Jaeger)
- a log aggregator/forwarder
- Prometheus for collecting and storing observability data
- Grafana for data visualization
- a log analysis stack
The trouble with such a setup is that it is essentially distributed and has many interdependencies for each component to function well. The amount of time needed to set up each of these components is also quite large and requires either pointed guidance or expert help. The storage tax certain vendors charge indirectly forces you to favour certain services, applications, and processes for logging and monitoring over others. A distributed Kubernetes environment should not always use a distributed monitoring system with usage or storage limitations, which is why we built Apica.
What is Apica?
Apica is a unified data platform for monitoring, observability, log aggregation, and analytics with an infinite storage scale to bring simple and powerful logging to the masses. Apica uses object storage for data at rest and allows the sending of logs from Kubernetes, on-prem servers, or cloud VMs with ease. The use of object storage also means that neither do we dictate how much log data you can store and for how long, nor do we force you to favour logging specific components of your environment over others – you get to log everything.
The Apica platform includes:
- A User Interface (UI)
- A command-line toolkit
- A monitoring stack for time-series metrics
- A log analytics stack for log data, and;
- A free library for pre-built, no-code monitoring and observability dashboards
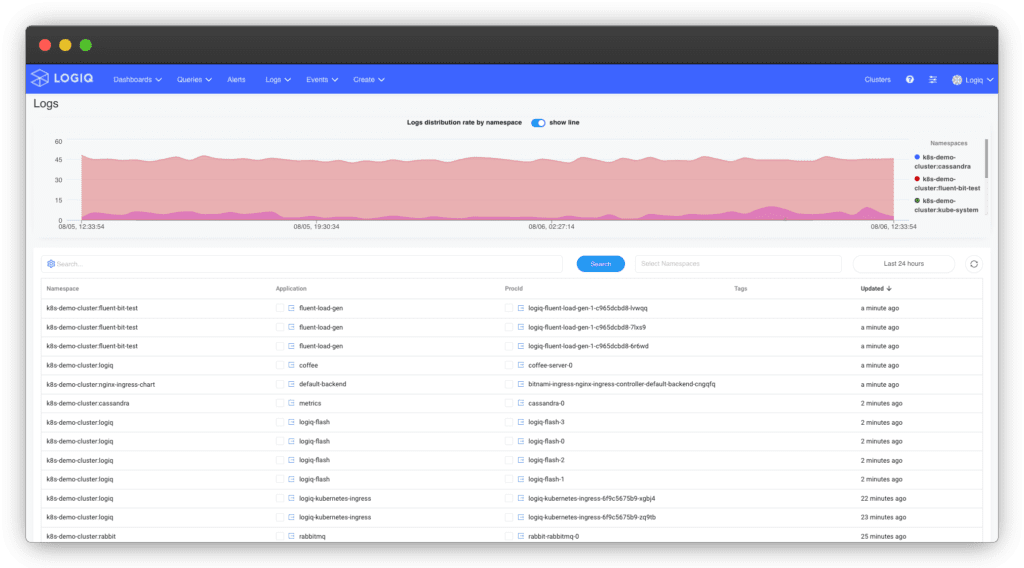
Apica is the only platform that automatically discovers namespaces and deployments from a Kubernetes cluster. The following image shows the Logs page on the Apica UI with logs categorized by namespace and applications.
This article looks at how you can set up a lightweight, full-featured monitoring and observability platform using Apica.
Installing Apica
We’ve packaged Apica as a Helm chart that you can quickly deploy on Kubernetes, MicroK8s, or K3s environments with minimal configuration. To install Apica on your Kubernetes environment, do the following.
Step 1: Add Apica’s Helm repository to your Helm repository by running this command:
helm repo add Apica-repo https://Apicaai.github.io/helm-chartsStep 2: Create a namespace for deploying Apica by running this command:
kubectl create namespace ApicaStep 3: Prepare the following values.yaml file for the Helm installation. This values.yaml file makes for a lightweight deployment of Apica.
For heavier deployments, use one of the values.yaml files we’ve provided on our docs site that is more suited to your deployment needs.
Step 4: Install Apica by running this command.
helm install Apica --namespace Apica \
--set global.persistence.storageClass=standard Apica-repo/Apica -f values.yaml
Running this command will install Apica on your Kubernetes environment, set up a Prometheus instance for metrics, and expose Apica services. The installation also provisions a 10 GB MinIO instance for storing your logs locally which should suffice to get you up and running but is not scalable. To unlock Apica’s truly unlimited scalability, we advise connecting your AWS S3 bucket with the Apica instance or provisioning another Kubernetes cluster for storage. Read Using an AWS S3 bucket on our docs site to know more about setting up your storage with Apica.
You can check the IP exposing the Apica UI by running this command:
kubectl get service -n Apica |grep -i loadbalancerYou can now log into your Apica instance by accessing the IP exposed above on your favourite web browser.
Installing a log forwarder
Now that we’ve installed Apica, we need a way to forward logs from your Kubernetes cluster to Apica. Apica supports integrations with popular log forwarders and aggregators like Fluentd, Fluent Bit, Logstash, Rsyslog, and Docker syslog. Our Client Integrations Bitbucket repository contain sample configurations for these services. You can clone the Bitbucket repository, pick the forwarding service you’d like to use, and follow the configuration instructions.
For Kubernetes clusters, we recommend using Fluent Bit for log forwarding. While sample configurations for Fluent Bit are available in Client Integrations, you can refer to the Fluent Bit documentation for more information.
Install Apicactl
Apicactl is Apica’s inbuilt command-line toolkit that lets you interact with the Apica Observability platform without logging into the UI. Using Apicactl, you can:
- Stream logs in real-time
- Query historical application logs
- Search within logs across namespaces
- Query and view events across your Apica stack
- View and create event rules
- Create and manage dashboards
- Query and view all your resources on Apica, such as applications, dashboards, namespaces, processes, and queries
- Extract and report log pattern signatures (up to a maximum of 50,000 log lines)
- Manage Apica licenses
Installing Apicactl also allows you to import pre-built monitoring and observability dashboards for popular services from ApicaHub directly into your Apica instance.
The quickest way to start using Apicactl is to download a pre-built binary from our release page on GitHub. Once you’ve downloaded the binary, you can configure Apicactl to interact with your Apica instance by doing the following.
Step 1: Set your cluster URL:
Apicactl config set-cluster CLUSTER_URLStep 2: Provide your Apica credentials:
Apicactl config set-ui-credential flash-userid passwordStep 3: Set your default namespace:
Apicactl config set-context NAMESPACEStep 4: Verify your Apicactl configuration:
Apicactl config set-context NAMESPACEApicactl is now ready for use with your Apica instance.
Import dashboards from ApicaHub
Now that all the necessary installations are out of the way, let’s jump right into the fun part. One of the fun things about using Apica is how effortless it is to set up monitoring, log querying, and metrics visualizations for popular services using dashboards from ApicaHub. The ApicaHub Kubernetes dashboard collections include monitoring and metrics visualizations for the following Kubernetes components:
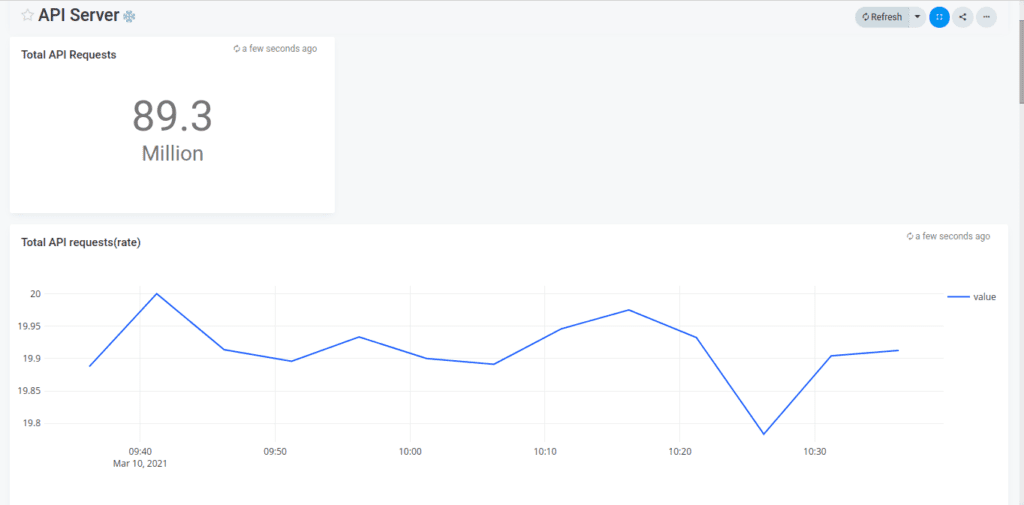
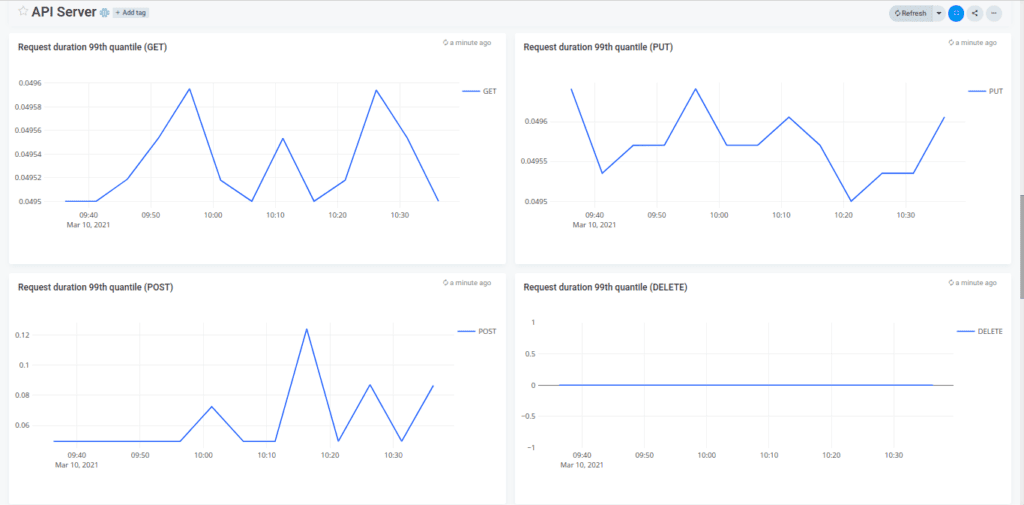
- The Kubernetes API server
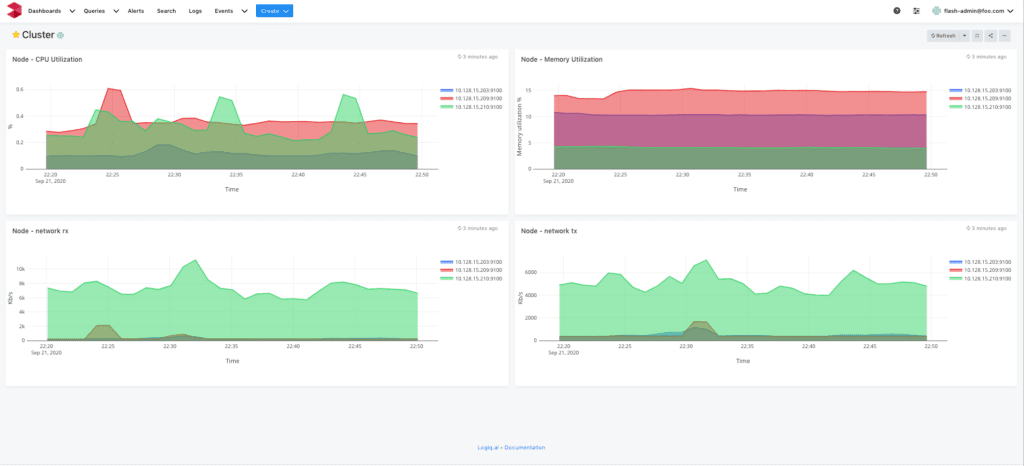
- Clusters
- Containers
- Pods
- Nodes
To use a ApicaHub Kubernetes dashboard, do the following:
- Download the Kubernetes dashboard JSON files from the ApicaHub GitHub repository. You’ll find 5 JSON files, namely,
api-server.json,cluster.json,container.json,kube-cluster.json, andnode.json. - Open each JSON file and edit the
datasourcessection to add your Prometheus endpoint, in case you’d like to use your existing Prometheus instance. - Configure the namespaces you’d like to monitor in the JSON files
- Run
Apicactlto import the dashboard JSON files by running the following commands:
Apicactl create dashboard -f api-server.json
Apicactl create dashboard -f cluster.json
Apicactl create dashboard -f container.json
Apicactl create dashboard -f kube-cluster.json
Apicactl create dashboard -f node.json
Next, log on to your Apica instance and navigate to Dashboards. You’ll now see the dashboards you configured and imported ready to be viewed. Clicking on a dashboard will display visualizations for all critical metrics and data across your Kubernetes environment.
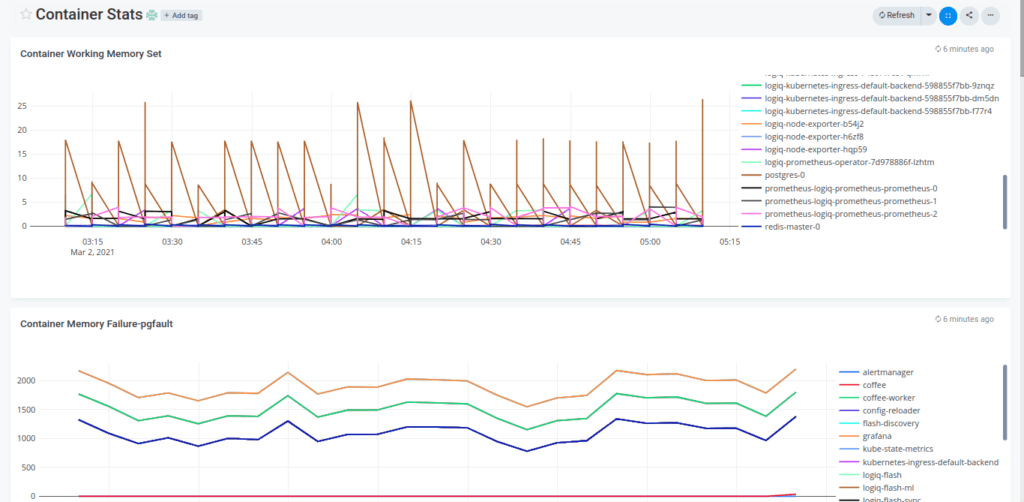
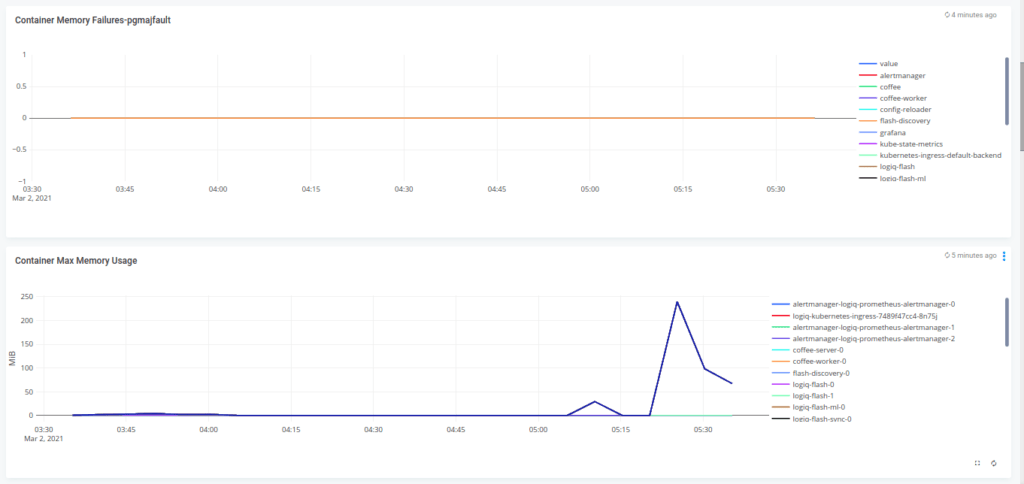
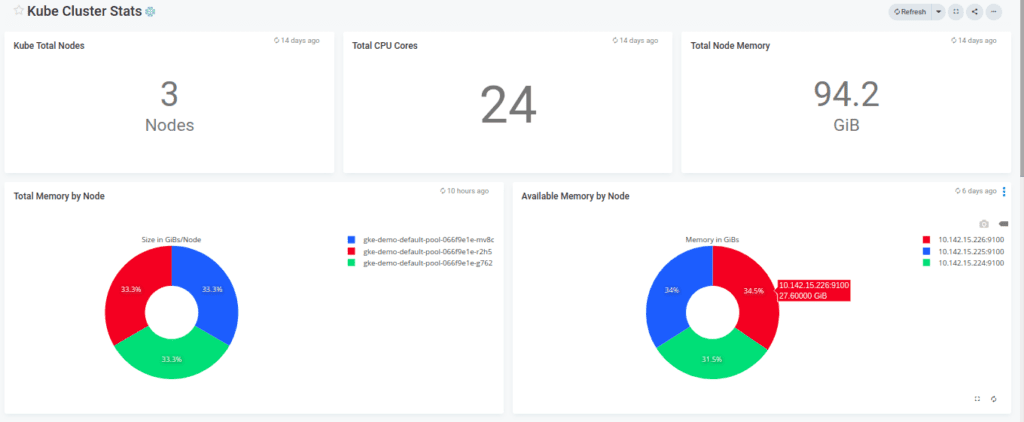
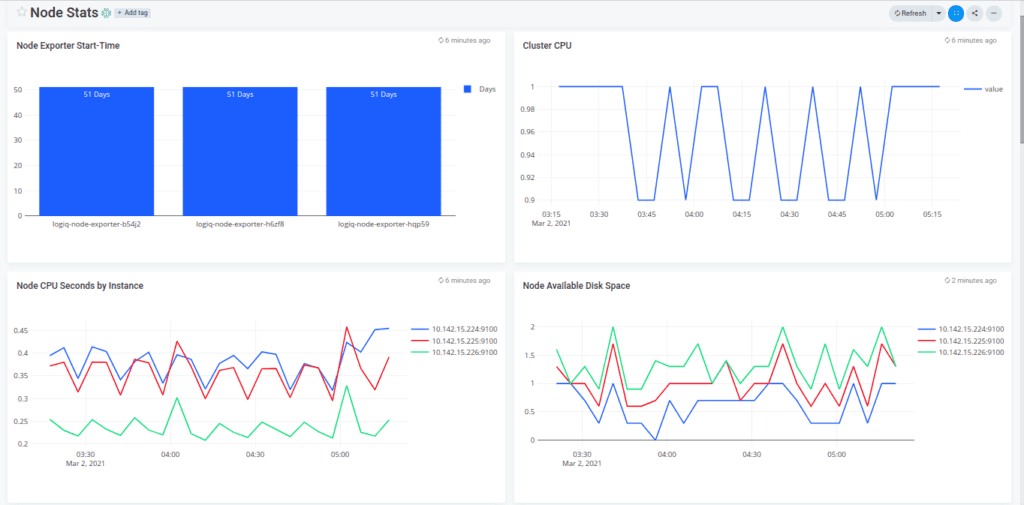
You can click on any visualization and further edit the underlying query if you wish to uncover more from it. Now wasn’t that easy?
Creating new queries and visualizations
You now have all of your critical Kubernetes components set up for monitoring and observability and their metrics and data visualized beautifully. What if you find the need to create more queries and visualizations that the default dashboards do not cover? Building queries and visualizations on Apica are as easy as importing these pre-built dashboards.
The following video demonstrates how easy it is to create new queries and visualizations, irrespective of whether you’re using an imported dashboard or not. The video dives deep into extending PromQL queries using Apica, setting up visualizations, and building custom dashboards to house your visualizations.
Conclusion
Setting up Kubernetes monitoring and observability shouldn’t be as complex and tedious as it has been so far. Your Kubernetes monitoring stack should also not be distributed, limit your log storage, or lock you into using specific tools or vendors for any operation in your monitoring and observability process. Instead, it should get you set up fast and easy, do the opposite of everything we just listed, and let you dive deep into the unknowns of your Kubernetes environments to uncover actionable insights – all while not charging you a ton of money for proprietary tooling and log storage or making you choose between what you should and should not log.
If you’d like to give Apica a spin on your existing Kubernetes environment, do check out the Kubernetes quickstart guide on our docs site. You should also read our quickstarts for MicroK8s and K3s if you’d like to run a lightweight deployment of Apica for testing purposes.


