
Observability data has three types: metrics, traces, and logs.
- Metrics are numerical values that represent some aspect of a system at a given point in time. Examples of metrics include CPU utilization, memory usage, and network traffic.
- Traces are a record of the steps taken by a request as it flows through a system. Traces can be used to understand the performance of a system and to identify bottlenecks.
- Logs are a record of events that have occurred in a system. Logs can be used to debug problems, understand user behavior, and monitor for security issues.
In this article, we will look at how anomaly detection techniques can be applied to time-series metrics for observability use cases. There are many different anomaly detection algorithms, but they all share a common goal: to find data points that are significantly different from the rest of the data. This can be useful for identifying outliers, monitoring for unusual behavior, and detecting errors in data collection.
There are many different ways to measure anomaly, but one common approach is to use a statistical model to identify points that are significantly far from the mean or median. Another approach is to use a machine-learning algorithm to learn what is normal and then identify points that are significantly different from the learned model.
Anomaly detection can be used for a variety of time-series data, including server metrics, application logs, sensor data, and financial data. By understanding how anomaly detection works, we can more effectively monitor our systems and diagnose problems when they occur.
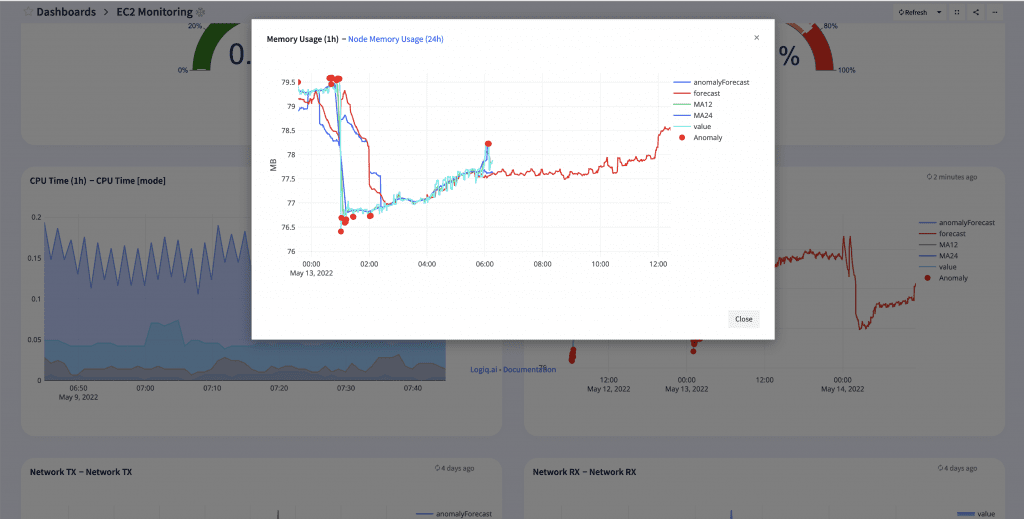
For example, let us consider the time-series metric for memory usage of a server. With anomaly detection, we could detect sudden spikes in memory usage that could indicate a memory leak. This would allow us to take action to fix the issue before it causes problems for the server or for the applications running on it.
One other way anomaly detection for time-series metrics can be helpful is to eliminate alert noise. If you’ve ever been woken up in the middle of the night by a loud, unexpected alarm, you know how important it is to be able to filter out the noise and focus on the signal. The same is true for alerts: by understanding which data points are most likely to be anomalous, we can more effectively focus our attention on the things that matter and alert only on those anomaly points. Alert fatigue is all too real and triggering alerts on simple thresholds can lead to too many alerts and even missed alerts when applied to time-series metrics. Read up more on alert fatigue on our blog here – https://www.apica.io/are-you-stuck-with-alert-fatigue-in-your-observability-stack/
In conclusion, anomaly detection is a powerful tool that can be used to identify unusual behavior in time-series data. By understanding how anomaly detection works, we can more effectively monitor our systems for potential issues and diagnose problems when they occur.