
In a Glimpse
- Root cause analysis is a process used to identify the underlying cause of a problem or event, and topology timelines are an essential tool for this.
- A topology timeline provides administrators with a clear view of the system’s behavior, enabling them to quickly identify trends and correlations between different components.
- It also reveals information about system dependencies that may not be immediately obvious from looking at individual components in isolation.
- Apica’s solution offers advanced features such as data flow pipelines, aggregates of search results, and redesigned landing page OSSEC HID mappings OpenTelemetry otel.status_code mapping Memory and performance improvements Automated agent installation for Linux & Windows, helping organizations solve problems faster than ever before by visualizing data flow in a topology.
- By integrating the topology timeline with existing systems and processes, teams can collaborate more efficiently to accurately analyze complex problems while reducing the time and resources required to solve them.
Root cause analysis is a crucial step in identifying and fixing performance problems in complex systems. A topology timeline is a visual representation of the relationships between the different components of a system and how they interact over time. It is a valuable tool for root cause analysis because it provides a clear and concise view of the system’s behavior, enabling administrators to quickly identify the root cause of a performance problem.
With a topology timeline, administrators can easily spot trends and correlations between different components of the system without having to manually trace the entire system. This helps them pinpoint precise causes for performance issues more accurately and quickly than ever before.
Furthermore, a topology timeline also reveals information about system dependencies that may not be immediately obvious from looking at individual components in isolation. This can help administrators better understand how different parts of the system interact and identify areas where they may need to address potential bottlenecks. Overall, topology timelines are a powerful tool for helping administrators improve system performance and reliability.
What is Root cause analysis?
Root cause analysis (RCA) is a method used to identify the underlying reasons for an incident, problem, or failure. The goal of RCA is to find the root causes so that effective corrective actions can be taken to prevent similar incidents from happening again in the future. RCA typically involves a systematic and structured approach, including data collection, data analysis, and identification of causes. RCA can be applied in various fields such as engineering, healthcare, and IT, to improve processes, systems, and products.
In other words, it is a process that is used to identify the underlying cause of a problem or event, in order to prevent it from happening again in the future. The topology timeline is a critical component of root cause analysis, as it helps to reveal the precise order of events that led to the problem. By creating a topology timeline, analysts can gain a clear understanding of the series of events that led to the problem and identify the root cause of the issue.
The topology timeline can be created by mapping out the series of events that led up to the problem, including any calls or interactions between systems and processes. This information can be gathered through log files, network data, or other sources of information that can provide insight into the problem.
Once the topology timeline has been created, analysts can use it to identify the root cause of the problem by looking for patterns or trends in the data. For example, they might look for instances where multiple systems or processes failed at the same time, or where a particular call to a system triggered a chain of events that ultimately led to the problem.
Once the root cause has been identified, the next step is to determine how to fix, compensate, or learn from the underlying issues. This might involve making changes to systems or processes, updating policies and procedures, or taking other steps to prevent similar problems from happening in the future.
The importance of a topology timeline in root cause analysis
Here are some of the key benefits of using a topology timeline in root cause analysis:
- System Awareness: A topology timeline provides a complete view of the system, including the relationships between components and how they interact over time. This helps administrators understand the system as a whole, rather than just focusing on individual components.
- Visualization: The graphical representation of a topology timeline makes it easy for administrators to quickly identify performance problems and understand the root cause. The visual representation of the timeline also helps administrators to understand the relationships between different components, making it easier to pinpoint the root cause of a problem.
- Time-based Analysis: A topology timeline provides a time-based analysis of the system, allowing administrators to see how different components interact over time. This is especially important when dealing with performance problems, as it helps administrators to identify the root cause of a problem by analyzing the timeline of events leading up to the performance issue.
- Improved Collaboration: A topology timeline can be used as a shared tool for collaboration between different teams and stakeholders. This helps ensure that everyone is working from the same information and understanding, reducing the risk of misunderstandings and miscommunications.
- Streamlined Problem-Solving: By using a topology timeline, administrators can quickly identify the root cause of a problem and implement a solution, reducing the time and resources required for problem-solving.
Apica’s Topology Timeline Features
Root-Cause Analysis just got easier with Topology-powered analysis!
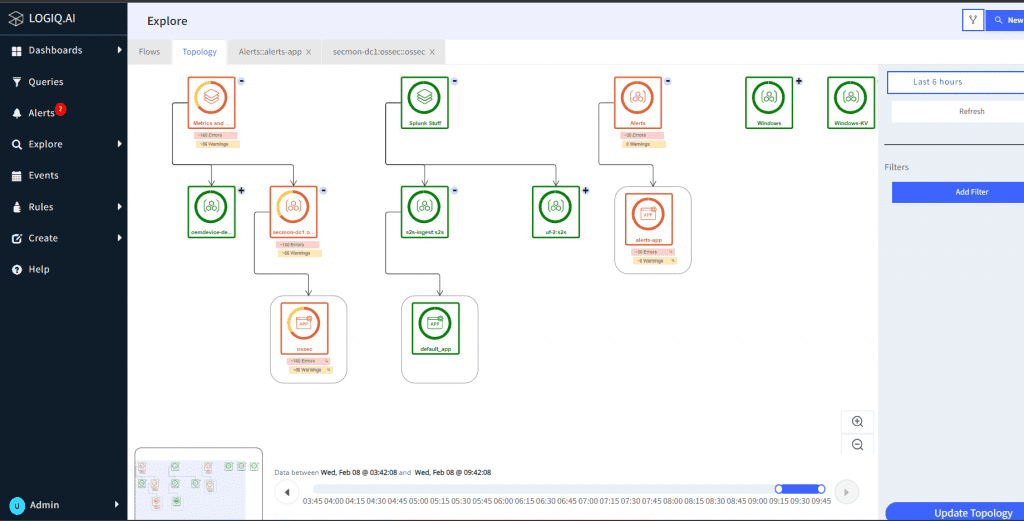
Apica’s solution is designed to help you quickly identify and resolve issues in your applications by visualizing your data streams in a topology. With our advanced features, you can quickly investigate errors or alerts with just a click, allowing you to resolve issues faster than ever before.
Here’s a closer look at some of the key features:
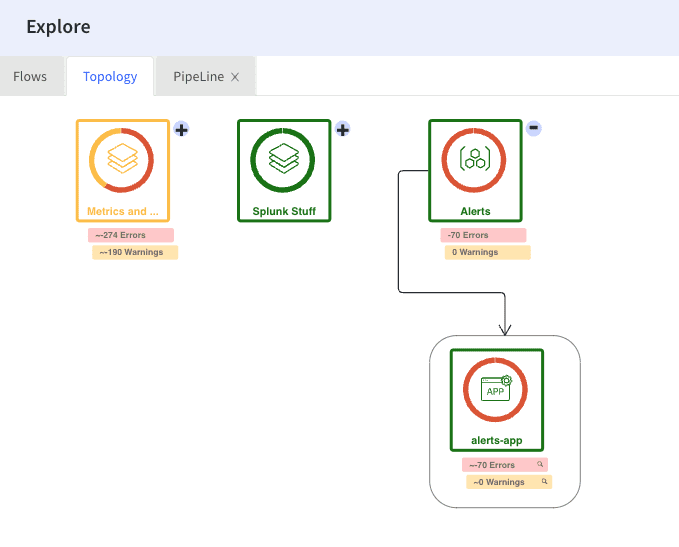
Data Flow Pipelines
With the Data Flow Pipelines, you can visualize the flow of your data as it moves through different stages of the pipeline. You can see the nodes, rules, and filters applied to the data, making it easier to identify any data loss or optimize the flow of data to its final destination.
Search Results Aggregates
Our built-in pivot table makes it easy to analyze large datasets from your search queries. With a variety of aggregation functions (Count, Value, Sum, Count Unique Values, List Unique Values, Average, Median, Min, and Max), you can summarize and visualize your data for instant analysis. We offer a range of visualizations including Tables, Line charts, Area charts, Scatter charts, Dot charts, and Multiple pie charts, giving you the flexibility to choose the right one for your needs.
Redesigned Landing Page
We’ve revamped our Explore page to provide you with instant access to valuable insights. When you log in, you’ll now directly land on the Explore page with quick summaries at your fingertips. We’ve introduced counter widgets for EPS, Total Flows, Total Events, Forwarders, and App Extensions, as well as a new Event Statistics column that displays counts of Errors, Alerts, Critical, Emergency, Warnings, and Total events.
OSSEC HID Mappings
Automatically map OSSEC HID event severity and log messages for Linux and Windows environments, making it easier to identify and resolve issues.
OpenTelemetry otel.status_code Mapping
Our solution detects OpenTelemetry severity and level embeddings and maps them into severity levels, helping you quickly identify and resolve issues.
Memory and Performance Improvements
We’ve made significant improvements to the memory and performance of our solution, ensuring that you experience fast and smooth performance.
Automated Agent Installation for Linux and Windows
We’ve made it easier than ever to get started with our solution with automated agent installation for Linux and Windows.
With apica.io’s Topology-powered root-cause analysis, you can resolve issues faster and keep your applications running smoothly.
Bottomline
By integrating the topology timeline into your existing systems and processes, you can increase efficiency and availability. Organizations can use the topology timeline to quickly identify potential issues that could arise in the system as well as any changes that would need to be made for them to ensure optimum performance.
Additionally, teams can work together to analyze complex problems more easily, with the timeline offering an accurate visualization of events that led to the problem. With these tools and features, you can confidently tackle time-sensitive problems quickly and easily.
The visual representation of the timeline, time-based analysis, improved collaboration, and streamlined problem-solving make it a valuable tool for administrators, reducing the time and resources required for problem-solving and improving the overall performance of the system.
In conclusion, a topology timeline is an essential tool for root cause analysis in complex systems. It provides a complete view of the system, enabling administrators to quickly identify performance problems and understand the root cause. By creating a topology timeline, analysts can quickly identify the root cause of a problem, and take steps to prevent it from happening again in the future.


