
For all the productivity gains created by DevOps, there’s a nasty side effect. Short release cycles, lots of infrastructure changes, and developer-driven changes to live environments make for a recipe for frequent production issues. When problems occur, developers are being pulled to troubleshoot, which can be painful. Have you ever been on a production server and needed to troubleshoot an issue? Maybe there is an NGINX error or a 700 error from your Redis store. The first course of action is to drop down to terminal, SSH into the environment (assuming you have access), and begin tailing log files to determine if there’s anything out of the ordinary. When the problem isn’t immediately obvious, you may use a combination of tailing and grep to narrow down on errors.
Debugging production issues can be frustrating. The more complex your system, the longer the debugging process will take. Tailing logs to files can provide contextual clues. But there’s no easy way to search log tails in real-time so sorting through them is a tedious endeavor (not to mention cumbersome in larger environments) until now.
Live tail logs from the Apica UI
It was always possible to live tail logs as they’re ingested into Apica using Apicactl. We’ve extended that functionality to the Apica UI, making it simpler than ever before to live tail logs across your environments. Live tail within the Apica UI (we call it Live Logs) lets you:
- select any active log namespace and launch live tailing into a separate window
- highlight occurrences of keywords you specify within the log stream
- pause and resume live tailing on-demand
- auto-scroll the streaming window as your logs fill in
- download incoming logs as a JSON file
Live Logs is now available for all apica.io and LogFlow users via the UI and Apicactl.
Using Live Logs
Tailing your logs live using Live Logs is super simple. First, log onto the Apica UI and click Logs. Next, select the application or namespace you’d like to tail, click the Options menu, and then click Live Logs.
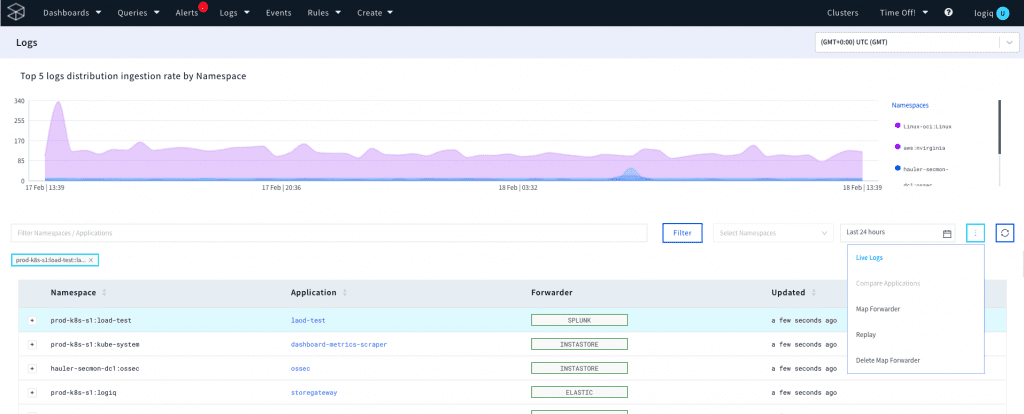
This opens a new window that streams your incoming logs in real-time.
From here, you can pause and resume live tailing on-demand, download the current live stream as a JSON file, and search for keywords of interest so that they’re highlighted within the log stream. You can also set the stream to auto-scroll so that the latest log stream is always in view.
What are the benefits of live tailing logs?
Apart from the obvious benefit of never having to SSH into an environment to tail and grep for patterns, there are plenty of benefits to live tailing.
Debug production issues faster and in real-time
Imagine logging into a variety of tools to track your application’s logs and troubleshoot. Developers constantly use this approach. We boot up our web server and log directly into it. We then navigate over to an application monitoring tool to see what’s going on within that, before navigating our way to yet another tool or service that was used in building the app. This is inefficient, complicated and doesn’t scale well in a production environment with multiple teams working on different services. With Live Logs, you can tail logs in real-time without ever having to SSH into a business-critical application or box, see exactly what’s going on, and get to the bottom of production issues faster.
No more waiting for access or log exports
You know how when you’re in production troubleshooting issues, it’s hard to get access to logs? You have to request them, wait for them to be delivered, then copy and paste all that information into a hosted log viewer. And all of these logs are offline by then, so they don’t give us the context we need. Apica lets you govern and control access to log streams without giving access to the actual data source. Using your user privileges on Apica, you can access and tail the log stream you need in real-time and export the log files you need for your analysis with a single click.
Eliminate redundant tools, control costs
Let’s face it: monitoring logs and tailing them to find the root cause of a technical issue is generally… frustrating. It has to be, right? Having to toggle between two separate tools just to tail your logs and perform analytics is far from ideal too, not to mention the time, money, and resources wasted in doing this. With Apica, you can do both (and way more!) through a single interface. Apica makes it way simpler and faster to access, troubleshoot, and debug production issues in real-time. No SSH, no access, no waiting required. You can now eliminate the need for additional tooling, break through silos, and do everything you need to with machine data in a single tool.
Conclusion
When it comes to tailing logs, most folks are familiar with the built-in tail command. But when log files get large (which is almost always) this technique can be slow and inefficient because each time you want to look at a different part of the log file, you have to start at the beginning. Live Logs within the Apica UI makes things way easier for XOps teams. In the end, making debugging faster and easier is a win-win for everyone involved. After all, saving time means saving money—and netting some extra time to actually work on critical issues and enhancing overall business performance itself is never a bad thing.


