
It’s likely that you already know how helpful logs can be in analyzing the inner workings of your IT environments. Beyond that, you may be familiar with the concept of using log data for debugging issues, identifying threats, or gaining context of performance bottlenecks. Log data from a single data source can fulfill a variety of use cases. Your security team uses them to identify and respond to threats, developers and operations teams use them for troubleshooting performance issues, and business teams can use them to better respond to customer issues and enhance customer experiences. You need to monitor today’s distributed applications constantly, and there are many tools available to help you do this. But these solutions rely on having the right data at the right time — and not just the recently collected data. Like current log data provide numerous insights, historical log data is also essential.
The importance of historical log data
Historical log data provides a vital source of context, often more than recent data. It can provide an additional critical dimension to your root-cause analysis or when you’re troubleshooting a security or customer issue. Using historical log data, IT and security teams can gain insights into events that happened in the past or that happened in a specific timeframe. For example, if you are troubleshooting an issue, it may be helpful to understand how long that issue existed or what else was going on when it occurred. Or, when you’re reviewing historical logs to know where a compromise happened, it’s crucial to have access to all historical log data. You can also use historical log data for:
- security and compliance needs, such as forensic analysis of security incidents and proof of regulatory compliance
- audit requirements
- capacity planning, where you need to look at historical resource usage patterns in order to plan for future capacity needs
- troubleshooting performance issues by analyzing past performance trends with your current metrics
But it’s not easy to get access to the historical log data you need for these purposes because most monitoring solutions focus on real-time analytics — watching something happen as it happens, instead of looking back at how things were before.
Storing and accessing historical logs isn’t easy
Some organizations store historical log data in a data warehouse, while others leverage the storage layers of log management tools. These tools typically are designed to deliver the most recent data — but they don’t help you when you need to go back through older records. Historical log data is often compressed and archived for longer-term retention. Teams often need to unzip and extract them from the archives before getting them insight-ready. Organizations with bigger budgets may store logs for comparatively longer durations on hot storage. However, scaling this storage strategy is detrimental to your budget. Others roll old log data into long-term archives or dump them in cold storage. Still others keep their historical logs handy by indexing them in a conventional database or search engine.
All of these approaches have advantages and disadvantages. But they all have one thing in common: they make it nearly impossible to replay historical log data on demand for faster insights.
Replaying historical log data on demand with Apica
Regardless of the strategy an organization uses, there are times when it’s helpful to be able to replay historical log data in order to get insights from that data. For example, if a company wants to know what happened during a specific incident that occurred yesterday and suspects that there might be relevant information stored in the log files from weeks, months, or even years ago, you must be able to replay data on-demand with a few clicks rather than spend considerable time and effort.
One of the many things that Apica does brilliantly is operationalizing historical log data through instant data replays to targets. Apica does this by leveraging two aspects of the platform – InstaStore and Forwarders. InstaStore indexes ALL of your incoming data and stores them on S3-compatible storage. With all data fully indexed, you get sequential and random access to all of your data in real-time. Therefore, all of your data is always queryable and insight-ready when you need it, regardless of its age. Forwarders let you quickly configure and set up data pipelines from storage to your target systems. Apica ships with plenty of built-in forwarders, several of which are specifically built for platforms like:
- Splunk
- ArcSight
- DataDog
- Elastic
- RSA NetWitness
You can use these forwarders to ship historical data for any time range from InstaStore to a target system of your choice.
Replaying Historical Log Data Using Apica
You can connect these forwarders to your target systems in a few clicks and set up a forwarding pipeline for your historical and current data. In this example, we’ll take a look at how you can set up log forwarding from Apica to Splunk.
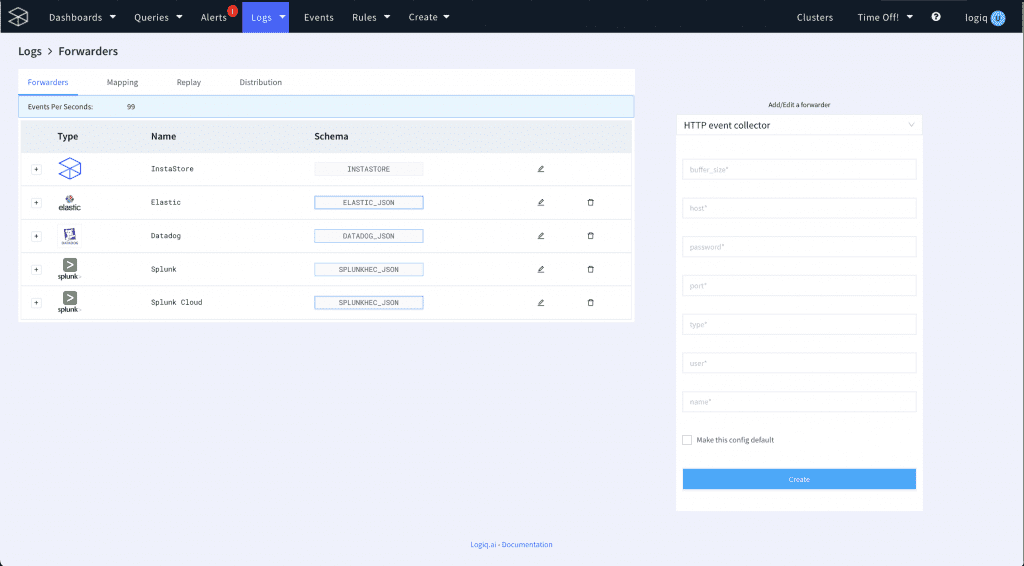
The first step is to set up a forwarder for Splunk, as described below.
- On your Apica UI, click Logs > Forwarders.
- Using the Add/Edit a forwarder dropdown, select a Splunk forwarder based on the type of data you’d like to forward.
- Configure the forwarder by providing details such as:
- buffer_size
- host
- password
- port
- type
- user
- name
- Select whether you’d like to make this the default configuration for forwarding data to Splunk.
- Finally, click Create.
Your Splunk forwarder is now ready to forward historical and current logs on demand.
Now that you’ve configured your forwarder, you’re ready to forward log data for specified time ranges to Splunk.
To forward data, do the following:
- Navigate to the Logs page.
- Select the Namespace/Application you’d like to forward data from.
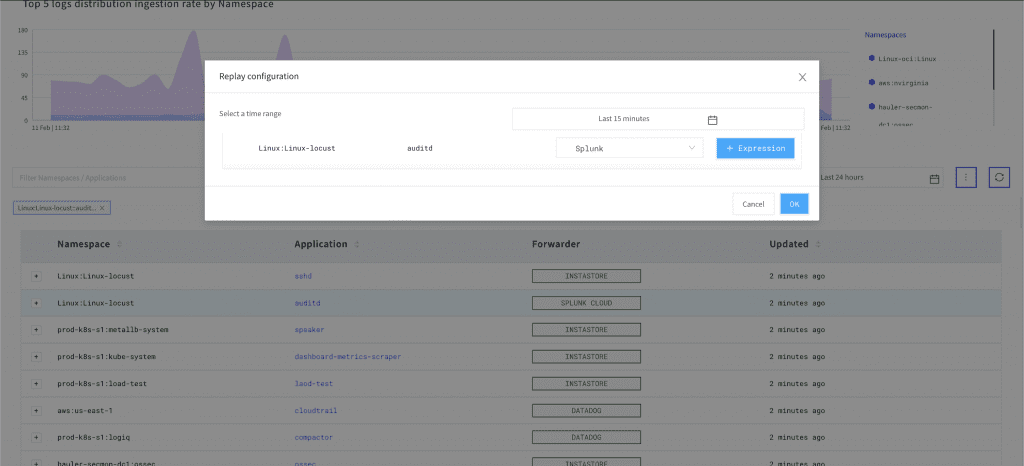
- Next, click the Options button and then click Replay.
- Select a time range from which you’d like to forward data.
- Use the Select a Schema dropdown to select the forwarder you’d like to use.
- Optionally, click the Expression button to add conditional expressions to filter the data you’d like to forward.
- Finally, click OK.
The data you selected will now be replayed to the target system you chose. You can confirm whether your data has been replayed by clicking on Logs > Forwarders > Replay. The Replay tab displays details of all of the data that has been replayed and the forwarder that was used.
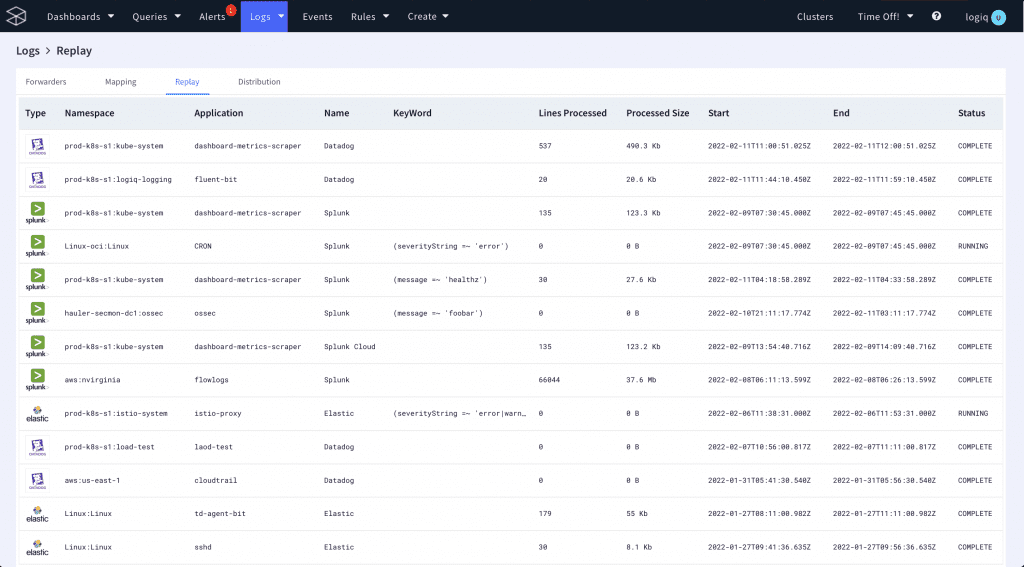
Alternatively, you can also check your data system to see whether the data you specified shows up in the system.
Conclusion
An on-demand approach to log file analysis enables developers to quickly understand which systems are impacted by an issue and which systems need to be troubleshot if the issue is intermittent. Replaying historical data can give you a deeper, more meaningful analysis of your applications over time. One of the most critical features that you need from a log management solution is the ability to play, or replay, historical data on demand to spot any issues. If a new problem arises in production, or even if an existing problem worsens, you’ll want to be able to go back through your logs and uncover the source of it. In short, playing back history is not only fun but super effective in making backlog items more actionable.
Apica is one platform that allows you to do this exact thing. It is the only platform that allows you to exercise complete control over your data pipelines by enabling you to:
- ingest data from virtually any data source
- enhance the value of in-motion data
- augment security events in logs for faster and earlier threat detection
- sample log data against built-in SIEM rules
- centralize logs, metrics, and events on a single platform
- convert raw logs to metrics and visualize them for faster analysis
- route data on-demand to any upstream or downstream target system in real-time
- store data for as long as you want to on any S3-compatible storage
Sign up for a FREE trial of Apica SaaS to witness first-hand how Apica simplifies Kubernetes logging, monitoring, and Active observability. You can also try out the free-forever Apica PaaS Community Edition that deploys via a Helm Chart on any Kubernetes distribution. If you’d like to know more about Apica and how it can help you with Active observability, data pipeline control, and storage, drop us a line.


