


Architecture
Topology Timeline: A Must-Have Tool for powerful Root Cause Analysis
In a Glimpse Root cause analysis is a process used to identify the underlying cause of a problem or event, and topology timelines are an
In a Glimpse Root cause analysis is a process used to identify the underlying cause of a problem or event, and topology timelines are an

The theory of the multiverse states that every possible outcome takes place somewhere, and from sausage fingers to pig superheroes from another dimension, Hollywood loves
Find out what is an Operational Data Fabric and what is it about. Get a detailed explanation of what are the key challenges, advantages, and

OpenTelemetry also known as OTEL or OTel informally, is a community-driven open-source project. In other words, it is an observability framework that includes software and
Observability and event log data are important. What’s more important, however, is the ability to figure out the relevance of the data. In other words,
Apica offers a suite of powerful AWS observability tools to help you monitor, troubleshoot, and understand the performance of your system.

The on-premise setup, widely known as an “on-prem environment” or “self-hosted environment“, allows organizations to customize their infrastructure while avoiding the costs associated with public
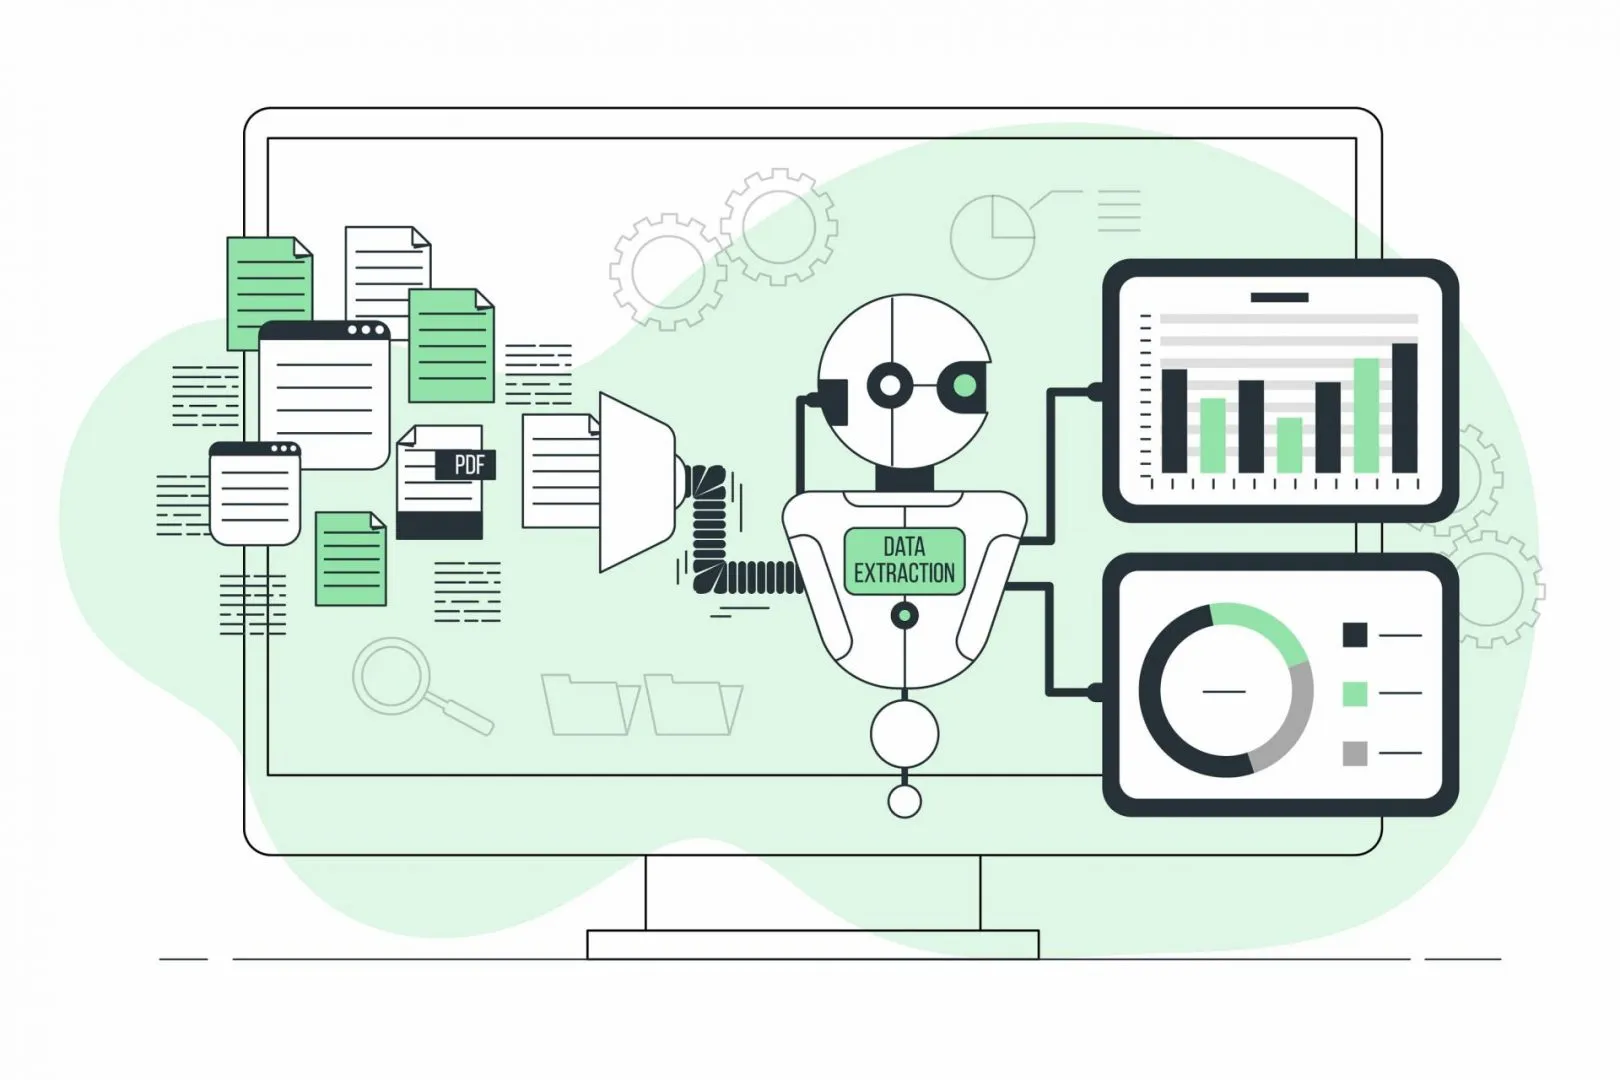
Machine data analytics refers to the process of collecting, storing, and analyzing massive amounts of data generated by machines, such as sensors, industrial equipment,

Part Three of the Humanizing Software Quality Series from Intellyx, for Apica In part 1 of this series, Jason English established user journeys as the