Table of contents
Distributed tracing has been recognized as an imperative feature in the DevOps toolbox for microservices over the last few years. Consequently, the open source observability community came together in April 2019 to create a new project called OpenTelemetry by combining the energies that had previously been split between OpenTracing which is termed as a vendor-agnostic API to assist developers in instrumenting tracing into their code base, and OpenCensus, which is an open-source project that emanates metrics and traces in application code). Companies like Amazon are also jumping on the OpenTelemetry bandwagon with AWS OpenTelemetry Distro.
Although distributed tracing as we know it has been available for more than ten years, there has been little to no interoperability across distributed tracing solutions up until now.For instance, until the development of W3C Trace Context, a standard supported by most participants in the observability and cloud offering arena, Jaeger and Zipkin, both well-known and frequently used, could not assemble a trace together.
Now, You can stream traces directly into apica.io from the OpenTelemetry Collector and Jaeger Agents.
Why Use OpenTelemetry
The OpenTelemetry development includes implementation guidelines for SDKs with several runtimes that enable data collection and reporting capabilities:
- Resource Information that identifies the emitter
- Traces, to explain how the emittent interacts
- Metrics that measure the effectiveness of the emittent
- Logs that are present in the early stages of development
To put it briefly, OpenTelemetry strives to provide the ideal libraries you require to create telemetry about your applications all in one place, with a focus on supporting open standards and interoperability. For instance, the W3C Trace Context standard is supported by OpenTelemetry. However, it enables users to “transform” distributed tracing data from OpenTelemetry systems into data for systems employing Jaeger and Zipkin.
Understanding Distributed Tracing
Tracing begins at the most fundamental level with Software Observability, which is a method for determining a system’s internal state from its outputs. Because this is not pragmatic, we want to incorporate telemetry into the process to more precisely read and record what particular components are doing through the collection and analysis of data.
Many times, highly complicated, widely dispersed systems are used to implement modern services. Applications can be created and maintained by several teams, who frequently operate in many places, using a variety of programming languages, and across numerous computers. Tracing enables us to comprehend system behavior and find possible problems.
After a system has implemented telemetry, you may begin following a single transaction as it travels through several services and components using a technique called distributed tracing.
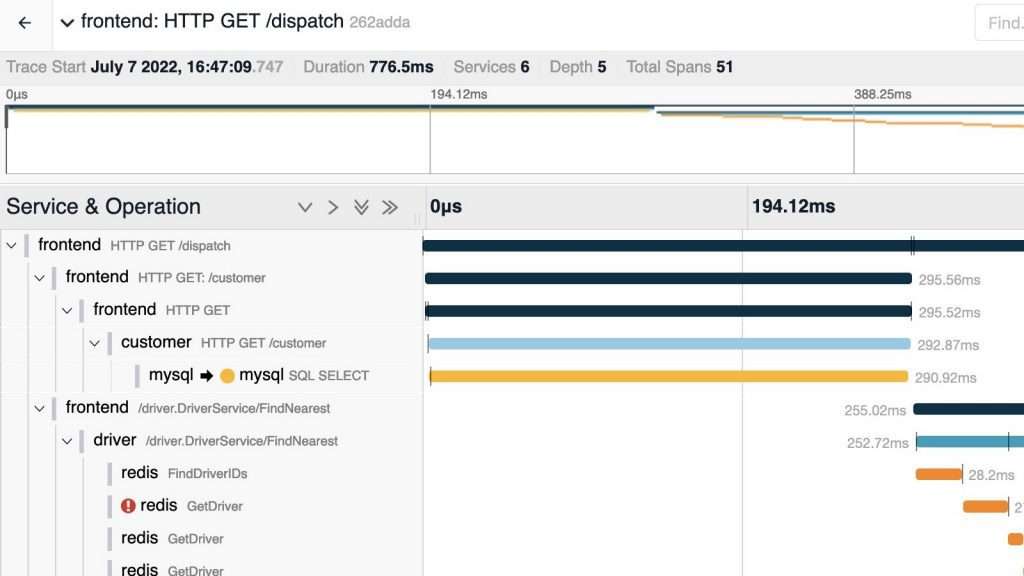
The very definition of distributed tracing is “creating a trail to observe what has transpired at each step.” Distributed tracing is a crucial component of day-to-day debugging and monitoring in cloud-native computing, where we frequently engage with distributed systems and microservice architecture.
See below for what a trace looks like in real life.
Advantages of OpenTelemetry compatiblity
The OpenTelemetry project was created by integrating the OpenTracing and OpenCensus projects. OpenTelemetry’s key benefits include, among others:
- A vendor-neutral and open standard means greater freedom for developers.
- A unified way of gathering metrics, logging, and traces simplifying the amount of tooling needed to do your job effectively.
- Ready to use programming language SDK’s that result in rapid adoption of a standard way of instrumenting your distributed application no matter which languages you use to develop them.
You may also transmit the measurements to a back-end server like Jaeger or apica.io to examine the performance and behavior of your apps once the OpenTelemetry collector or client has collected telemetry data like metrics, logs, and traces from your applications or app servers.
In particular, the data and data stream (telemetry) required to fully comprehend, diagnose, and enhance our applications are the emphasis of OpenTelemetry. Data is only helpful if it can be scaled up for aggregation, analysis, and visualization. Therefore, OpenTelemetry allows us to quit fretting about what data we can collect and instead concentrate on what we can do with the data, even though it doesn’t include instructions on how to show the data.
Instead of expecting us to attempt that connection manually, OpenTelemetry also offers a natural correlation between those data sources. We have arrived at Observability 2.0, a new standard for gauging application activity in the cloud, thanks to OpenTelemetry’s capacity to connect events across applications.
The Need for distributed tracing
Teams may now have a quicker understanding of each microservice’s performance thanks to distributed tracing. They can handle problems more quickly, improve customer experience, maintain constant income, and spare time for teams to develop thanks to this understanding. By doing this, companies may maximize the advantages that contemporary application environments provide while reducing the difficulties that their inherent complexity can also bring about.
Additionally, Distributed tracing is required by businesses to reduce the complexity of their contemporary application development tooling. There are additional possible failure spots throughout the entire application stack when using distributed apps. This implies that when problems develop, root cause analysis might take much longer. The ensuing complexity has a direct impact on a company’s capacity to uphold SLAs and deliver an exceptional customer experience.
Conclusion
OpenTelemetry has enabled modern apps to deliver greater insights into both the performance and problems of our complex modern application environment by focusing on the primary kinds of data we need to understand the applications. In order to make the transition to new applications more manageable, OpenTelemetry correlates our data and aligns it to semantic and conventional patterns.
The InstaStore solution from apica.io efficiently organizes, indexes, and stores all of your trace data in an object store. It is now possible to retrieve historical traces on an infinite scale. Want to look up the API call’s trace in order to determine the source of a problem that occurred two months ago? apica.io is your one-stop shop because our distributed tracing implementation helps you to get Tracing data compliance, long-term retention, and quick retrieval.


