Monitoring tools such as Prometheus allow a developer to measure application performance with a few lines of code. However, code changes to the application are not always possible. This is frequently the case when third-party software is deployed in your IT infrastructure. All hope is not lost though. Applications, be it legacy or new, come with logs that contain valuable information about health and performance. In this article we will convert logs to a real-time metric for actionable insights.
Let us look at a log line that looks interesting to us. We need to know whenever that happens in our IT environment. For e.g. in the screen below, we want to report all errors from the ingress controller.
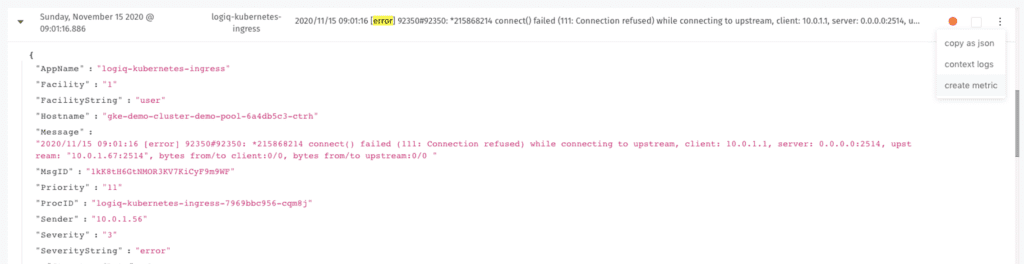
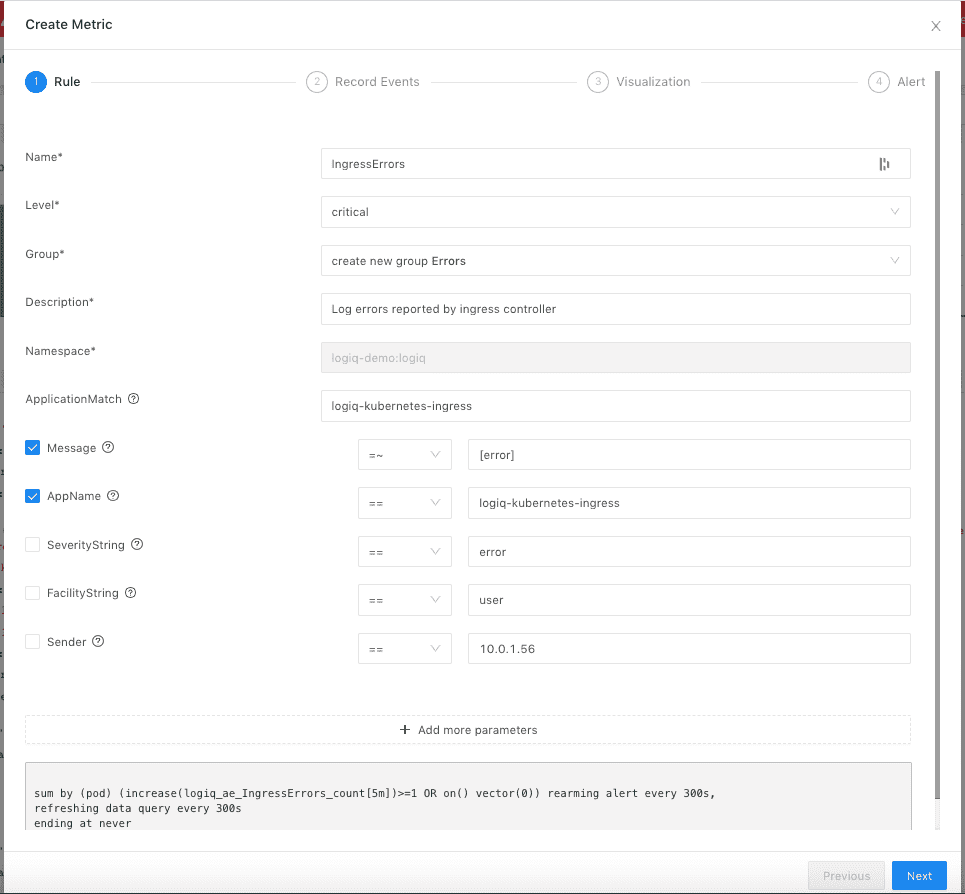
In the Apica platform, you get an option to convert log data to a real-time metric. This is available both in the search view and the Logs view. Just click on the log line to see the actions allowed. We will select “Create metric”. This should open the “Create Metric” modal to convert logs to a real-time metric. You will first define the matching criteria for your metric. You may optionally add the metric to a dashboard, record the metric or defined an alert!
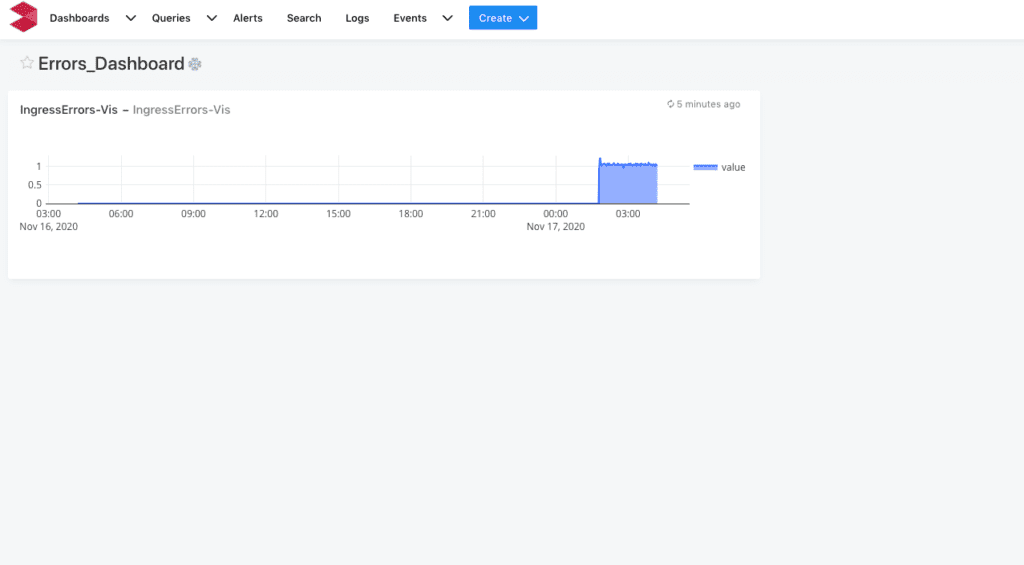
The metric is now ready to be visualized whenever the event occurs. An alert can be sent if configured thresholds are met. It’s that simple. Log2Metrics augments traditional monitoring capabilities by unifying logs and time series metrics.