


ApicaHub is officially live! ApicaHub is a collection of pre-built, ready-to-use dashboards for monitoring and observing important metrics for popular infrastructure and cloud services. Using these dashboards, you can go from installing Apica to instantly deriving valuable and actionable insights from logs and metrics from your infrastructure services.
ApicaHub dashboards are preconfigured to extract, plot, and visualize the most important performance, health, and usage metrics from your infrastructure and cloud services so that you don’t have to spend time writing queries and setting them up from scratch. These dashboards are the quickest, no-code approach to getting started with monitoring, observability, and data and metrics visualizations for your applications, services, and infrastructure on Apica.
Supported services
ApicaHub currently supports pre-built dashboards for the following services:
To use a ApicaHub dashboard, all you’ll need are:
- A Apica instance configured to ingest data from your data sources
- the Apica CLI – Apicactl
- A ApicaHub dashboard suitable for your service
The following section will help you get started with using a ApicaHub dashboard for monitoring your tech environment.
Using the ApicaHub Kubernetes dashboard
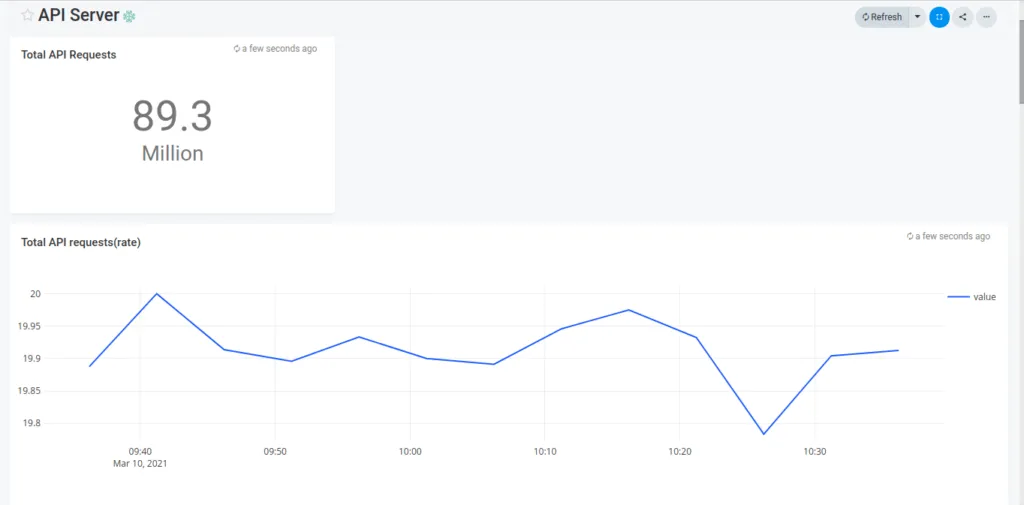
The ApicaHub Kubernetes dashboard is designed to monitor the following Kubernetes components:
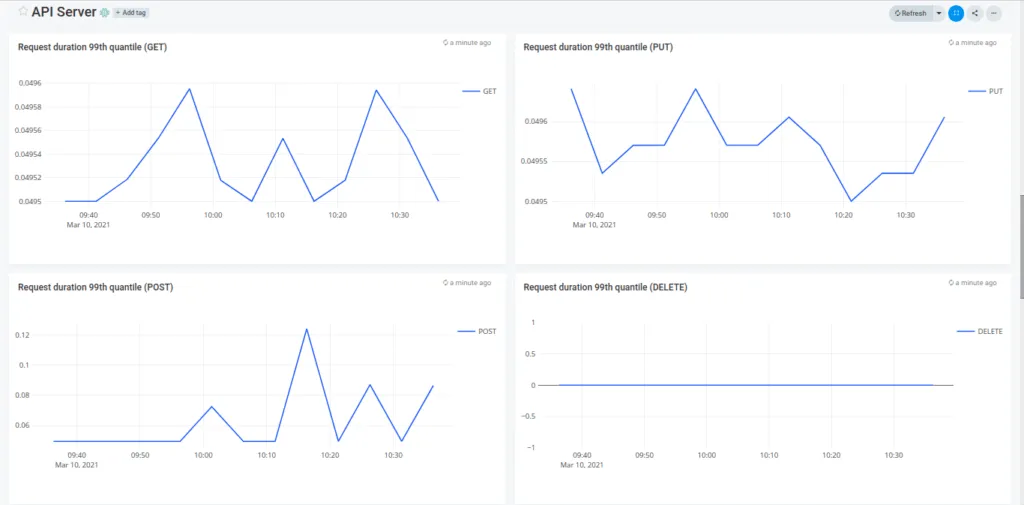
- The Kubernetes API server
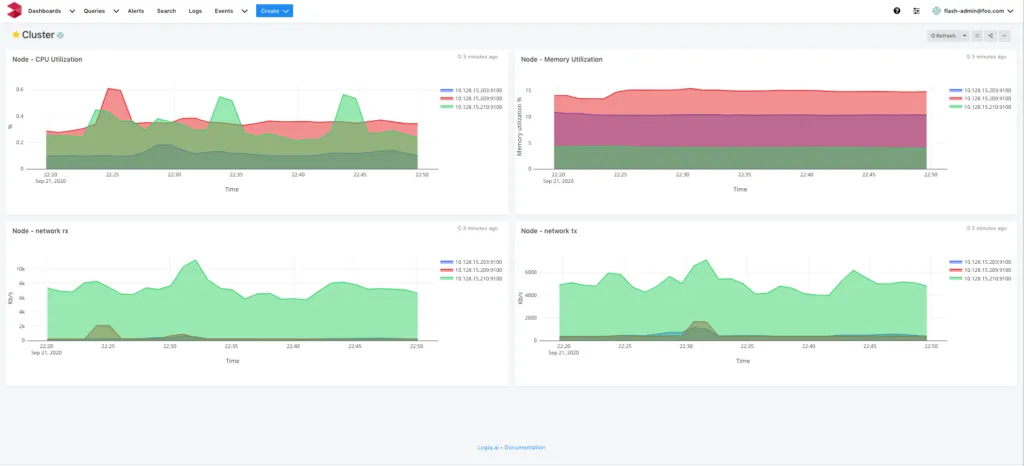
- Clusters
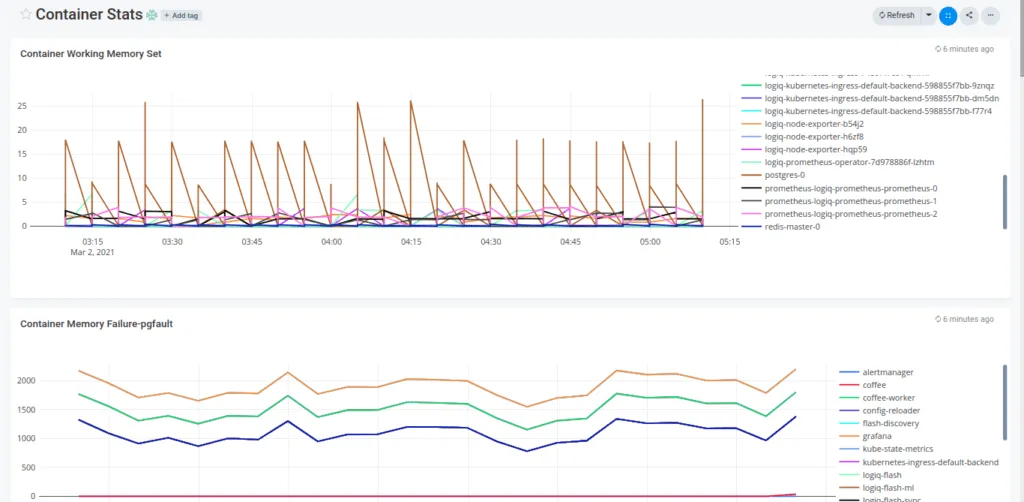
- Containers
- Pods
- Nodes
To use a ApicaHub Kubernetes dashboard, do the following:
- Download the Kubernetes dashboard JSON file from the ApicaHub GitHub repository.
- Open each JSON file and edit the
datasourcessection to add your Prometheus endpoint. - Configure the
namespacesyou’d like to monitor in the JSON files - Run Apicactl to import the dashboard JSON files by running the following commands:
Apicactl create dashboard -f api-server.json
Apicactl create dashboard -f cluster.json
Apicactl create dashboard -f container.json
Apicactl create dashboard -f kube-cluster.json
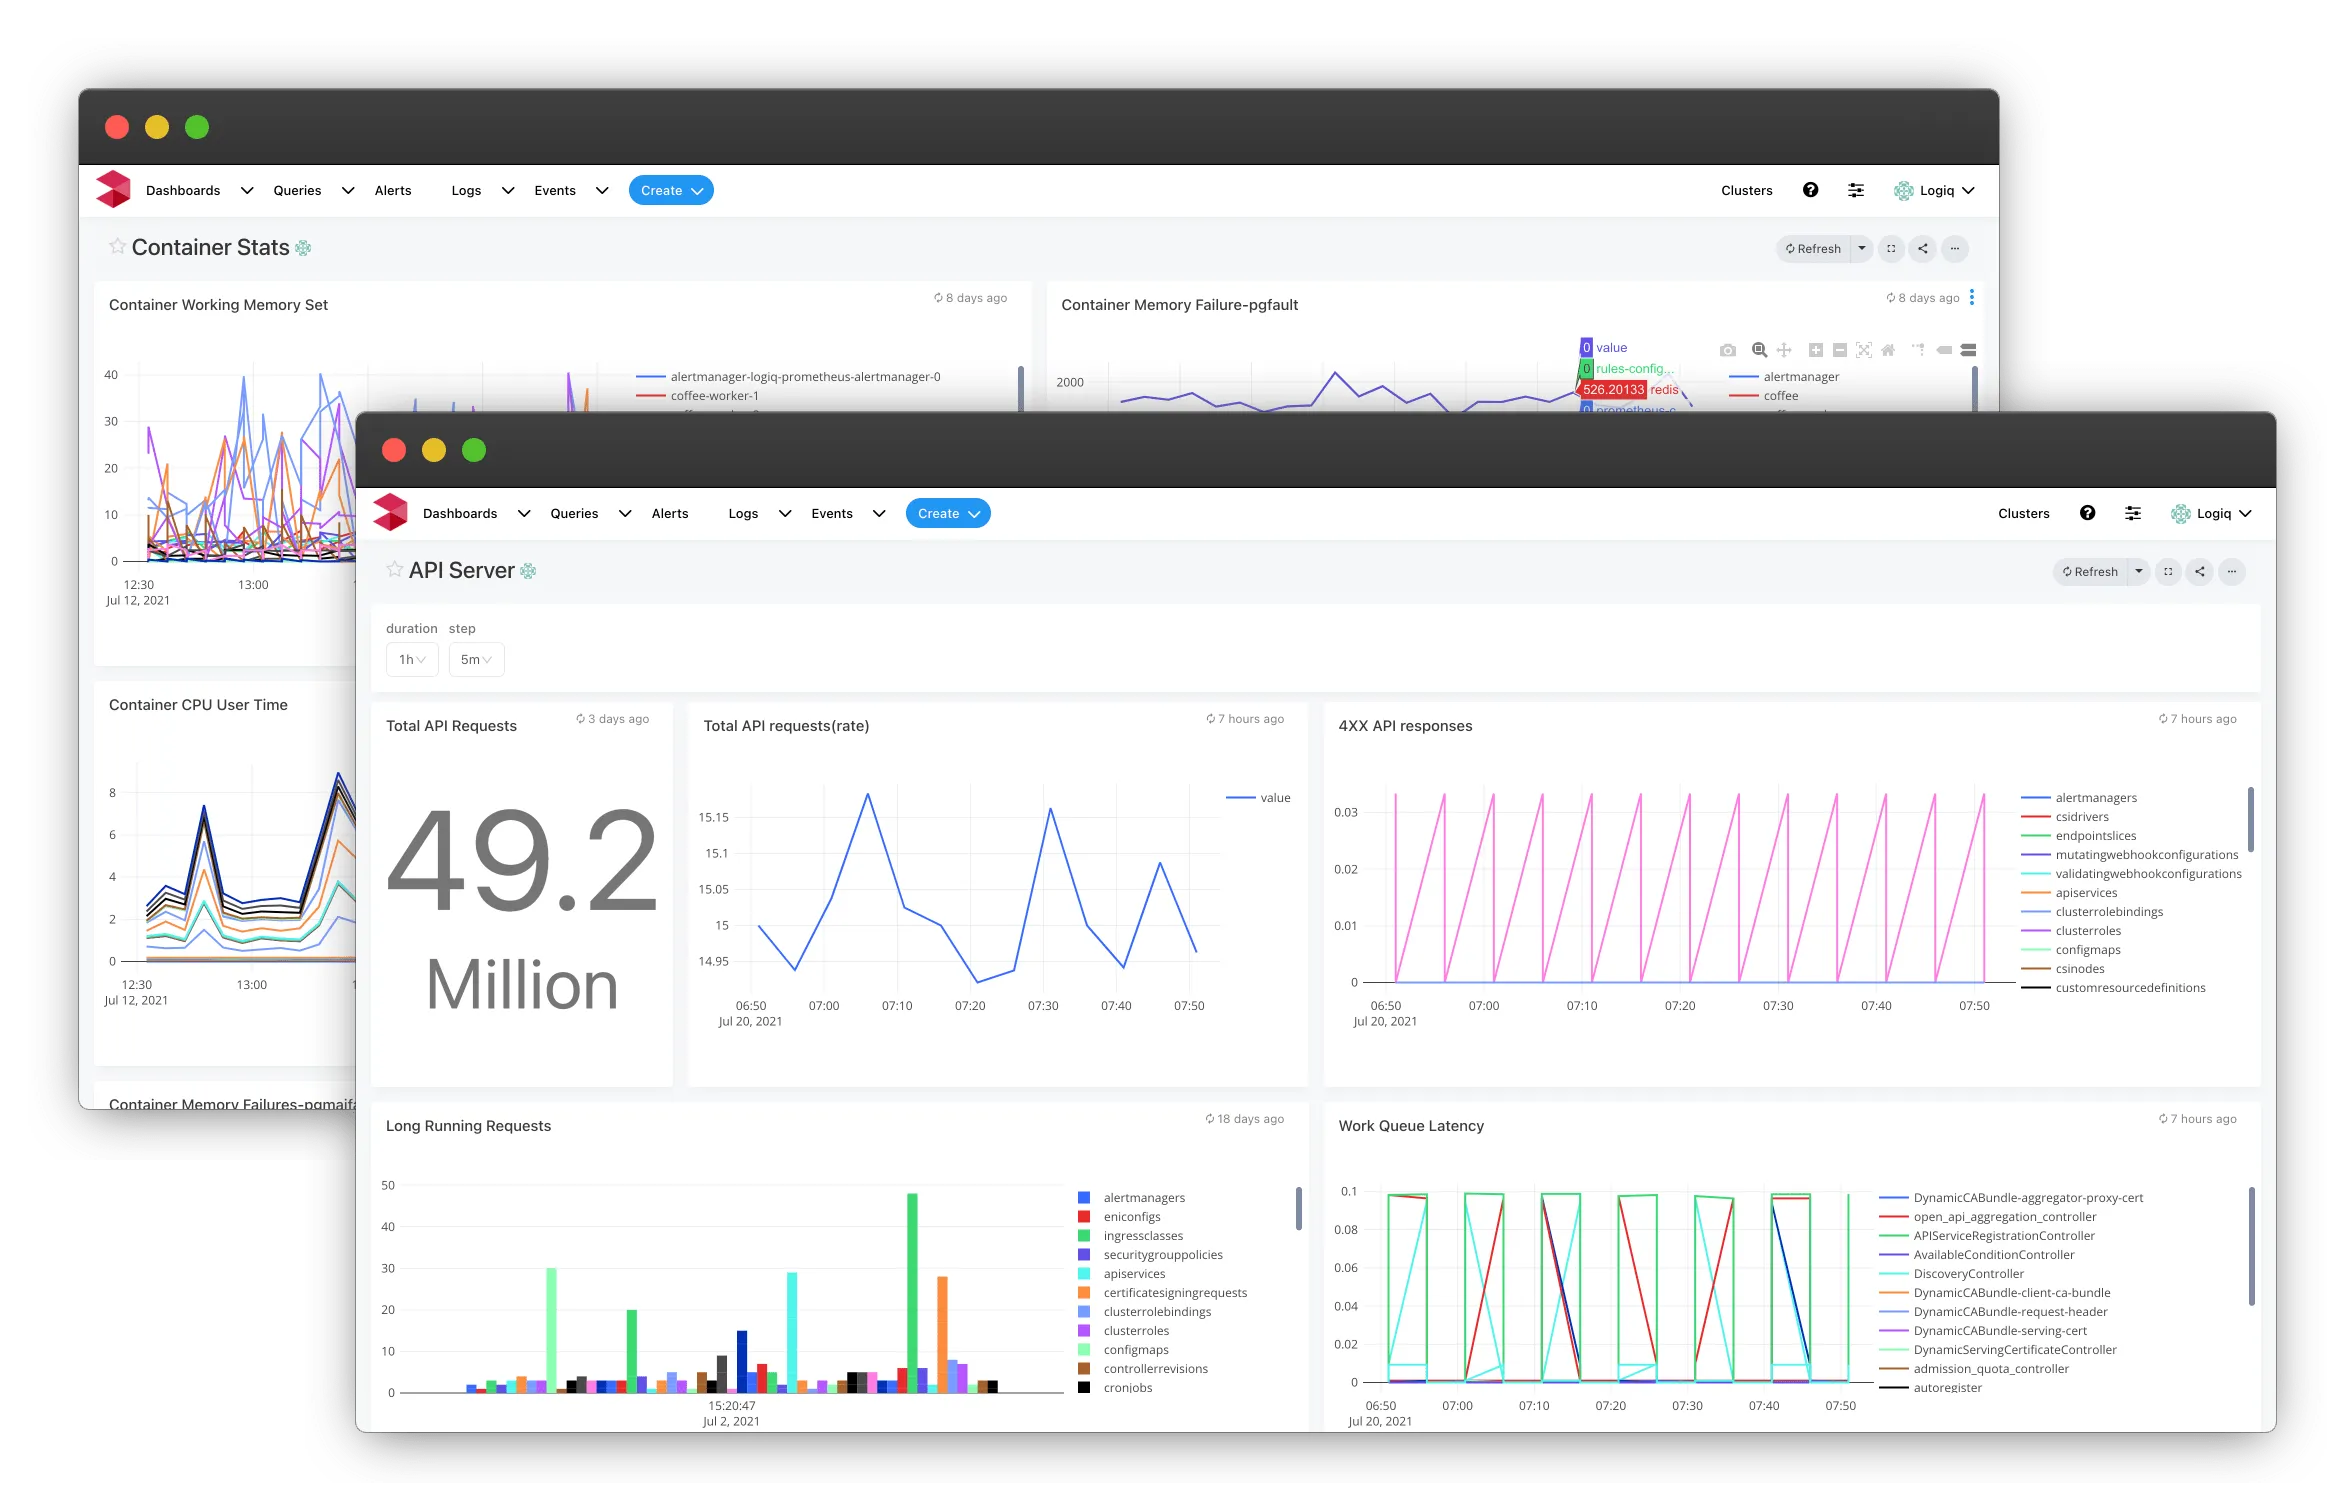
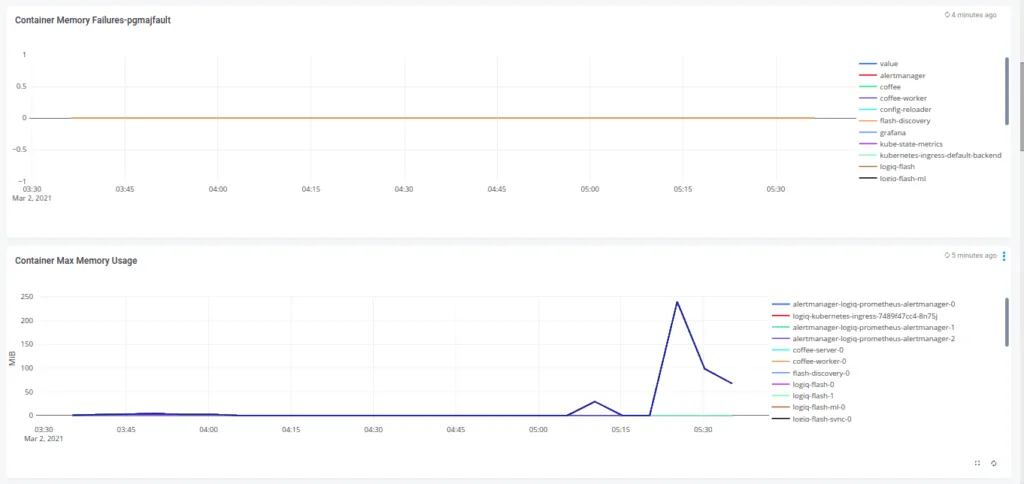
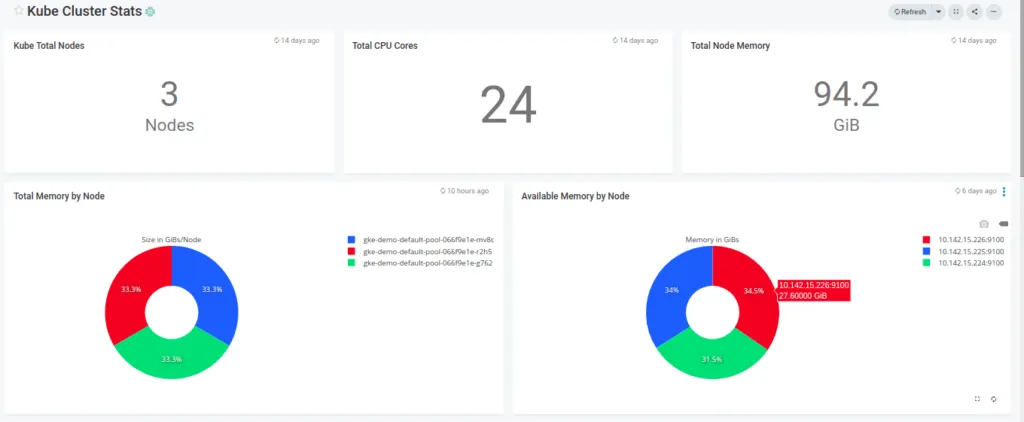
Apicactl create dashboard -f node.jsonWhen you log into your Apica UI and head over to Dashboards, you’ll now see a list of newly-created dashboards containing visualizations for all the critical metrics and data across your Kubernetes environment. The following images depict the dashboards, and data visualizations available in the ApicaHub Kubernetes collection.

Using any other dashboard from the collection involves the same set of steps. All you need to do is configure the dashboard JSON file to work with your service and import them into your Apica instance using Apicactl. You’ll be monitoring and observing your applications and infrastructure in no time.
The road ahead
The ApicaHub collection of dashboards will keep growing as we continue to build reusable monitoring and observability dashboards for more cloud services and infrastructure. If you’d like to see a monitoring dashboard for a service of your choice, drop us a line and we’ll get that built for you quickly. If you haven’t yet tried out Apica, do check out the free-forever Community Edition of Apica PaaS, try it out on your existing infrastructure using one of our pre-built dashboards, and see for yourself how easy monitoring and observability can be.
