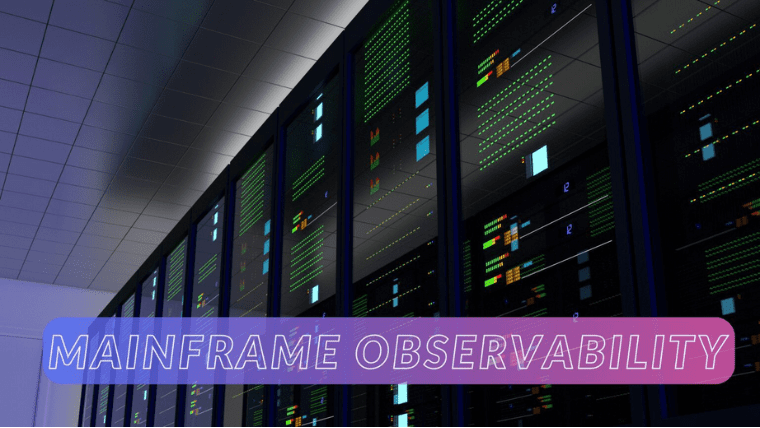
Mainframe Observability may be a niche term for the general crowd but Mainframe, in and of itself is not. From countless references in espionage movies to the perpetual discussions in online forums, Mainframes have always been the talk of the town. And for good reason, let’s see how.
If in recent memory, you’ve traveled, made transactions, or swiped your credit card, chances are that you’ve interacted with a mainframe, particularly an IBM mainframe.
Did you know that the IBM z16 mainframe is capable of handling 19 billion business transactions per day?
Now that’s a lot of transactions but where does Observability come into the picture? Can mainframes even be monitored, if yes then how? Why are enterprises struggling to achieve mainframe observability? And most importantly why does it matter?
In this blog post, we’ll answer all the aforementioned questions and highlight Apica’s monitoring capabilities when it comes to mainframe observability.
What is the significance of Mainframe Observability?
In an era dominated by cloud computing, it is easy to overlook the continued relevance and significance of mainframe systems. Yet, these robust machines remain indispensable for businesses that rely on processing millions of monetary or data transactions every minute to sustain their operations.
That being said, mainframe observability becomes crucial to avoid bottlenecks and downtime in real-time systems. You see, the more transactions and operations, the more the logs. Given the sheer massiveness of the data volume being produced today, monitoring has become extremely cumbersome.
When it comes to mainframe monitoring, every second there are hundreds and thousands of logs coming in. A lot of which includes logs from real-time activities like online transactions and enterprise data. Without powerful mainframe systems, it would be quite difficult to maintain sustainability in managing all that data.
Mainframes ensure fail-proof core operations and offer solutions for:
- The integrity of banking and financial markets with unmatched speed, scale, and security.
- Enabling real-time analytics during data movement, enhancing engagement in financial institutions.
- Integration of highly effective system security within the stack, making data encryption and protection more cost-effective and efficient compared to commodity infrastructure.
In summary, the data generated by mainframe systems holds immense significance within your organization, as it directly impacts the performance of distributed applications. However, a significant hurdle arises from the fact that mainframe telemetry data is frequently isolated from DevOps teams, creating a lack of visibility for essential tasks like application performance monitoring (APM), identifying problems, and conducting root cause analysis.
How does apica.io support observability in a mainframe environment?
The Apica Observability platform offers seamless mainframe monitoring by leveraging its ability to monitor and analyze everything from top to bottom.
Apica delivers comprehensive observability in mainframe environments by providing a real-time monitoring solution that can monitor multiple mainframes like Zs, DS8000s, and operating systems, utilizing open-source tools and APIs.
To handle fluctuating data loads, Apica employs an auto scale-out architecture that operates on a native Kubernetes platform. The system dynamically increases compute and storage resources to match the increasing data loads. This architecture enables seamless auto-scaling to address evolving data demands.
The compute layer of Apica uses Kubernetes containers, which allow autoscaling to handle sudden data spikes or gradual increases without manual intervention. The system can manage surging data rates by scaling out pods and nodes as needed.
To implement monitoring metrics, Apica integrates with Prometheus, an open-source tool for managing time-series databases. The system records interesting events in logs as metrics in Prometheus, which facilitates faster root cause analysis in a mainframe environment. This enables dimensional queries and visualization.
Following are the events that follow:
- Apica facilitates the transfer of data from various targets to Prometheus for storage.
- IBM Z provides a comprehensive API package, including the zHMC code, which enables efficient access to performance data.
- The zhmc-prometheus-exporter, developed using Python, serves as a Prometheus exporter in this context.
- Acting as a bridge between the IBM Z Hardware Management Console (HMC) and the Prometheus monitoring system, the exporter retrieves relevant metrics from the HMC.
- The exporter seamlessly exports the retrieved metrics to Prometheus, allowing for monitoring and analysis of the IBM Z system.
For a quickstart tutorial head, you can head over here.
IBM Observability by apica.io for z/OS
The IBM z/Architecture mainframes operate on the z/OS operating system, which is a 64-bit OS specifically designed for these mainframes. Within the z/OS environment, issues and notifications are communicated through messages that are recorded in logs.
To facilitate the monitoring and analysis of these logs, the Apica monitoring platform can ingest data via Syslog. Syslog is a standardized protocol that allows systems to transmit log messages across a network. In the case of z/OS, the Syslog data is sourced from a data set called SYSLOG.
SYSLOG is generated and maintained by the job entry subsystem (JES2 or JES3) and resides on direct access storage devices (DASD) as an output spool data set. It is advisable for system administrators to regularly print the SYSLOG for inspection in order to identify any potential issues.
SYSLOG captures a variety of messages, including those generated through WTL (Write to Log) macros, messages entered by LOG operator commands, and any messages directed to the SYSLOG from various system components or programs.
Moreover, Apica uses object storage as its primary storage layer, allowing the system to accommodate theoretically infinite data growth due to ingestion or long-term retention requirements. The platform combines the scalability, fast retrieval, and data archiving advantages of object storage with a Kubernetes container-based architecture to provide unparalleled operational agility.
Additionally, the Apica solution acts as a bridge between the IBM Z Hardware Management Console (HMC) and the Prometheus monitoring system, retrieving relevant metrics from the HMC and seamlessly exporting them to Prometheus for comprehensive monitoring and analysis.
Mainframe Observability and Beyond with Apica

While IBM Z drives numerous essential digital services behind the scenes, it frequently remains overlooked in enterprise-wide application performance management (APM) tools. As a result, identifying, analyzing, and resolving issues becomes challenging when they arise.
The emergence of modern observability platforms, designed to harness the power of cutting-edge technologies like Kubernetes and cloud-native microservices, further widens the gap.
Enterprises navigating this evolving landscape strive to bridge the divide between traditional reliability, current business requirements, and future innovation.
The Apica observability platform is designed to provide monitoring capabilities for various types of systems and environments, including mainframes, physical servers, monolithic applications, VMS (Virtual Machine Systems), cloud-native architectures, and microservices.
It achieves this through the integration and utilization of specific software, applications, and tools that are tailored to each environment.
Apica empowers organizations with its comprehensive observability platform, providing crucial support for monitoring and analyzing mainframe environments.
It enables efficient access to performance metrics and facilitates essential tasks such as application performance monitoring (APM), problem detection, and root cause analysis by seamlessly integrating mainframe telemetry data into the Prometheus storage system.
With Apica’s mainframe observability solutions, enterprises can gain valuable insights and ensure the optimal performance, reliability, and security of their mainframe systems.
In addition to that, the platform’s capabilities range from Legacy Workloads (Mainframe Systems, Physical Servers, Monolithic Applications) to Traditional Workloads (Client-Server Applications, Relational Databases, Java Applications, .NET Applications), and Modern Workloads (Cloud-Native Applications, Distributed Systems, DevOps and CI/CD, NoSQL Databases, Cloud Computing).
If you want to learn about our platform’s monitoring capabilities in more detail, which goes beyond mainframes and legacy systems, make sure to check out our Observability White Paper.


