AWS CloudWatch Logs provides a comprehensive solution for monitoring, storing, and accessing log files generated by various sources such as Amazon EC2 instances, AWS CloudTrail, and Route 53.
It offers a centralized and scalable service that allows you to consolidate logs from multiple systems, applications, and AWS services into a single location.
With CloudWatch Logs, you can easily view, search, and filter logs based on specific error codes or patterns, ensuring efficient log management and analysis.
One of the key advantages of CloudWatch Logs is its ability to present logs from diverse sources as a unified and chronological stream of events. Regardless of the original source, you can access all your logs in a consistent manner, ordered by time. This unified view simplifies log analysis and troubleshooting across your entire infrastructure.
That being said, CloudWatch Logs offers advanced features to enhance log querying and analysis. It provides a powerful query language that enables you to extract valuable insights from your logs.
Additionally, CloudWatch Logs supports auditing and data masking capabilities to ensure the security and privacy of sensitive information contained within logs. Furthermore, you can generate metrics from logs using filters or an embedded log format, enabling you to derive meaningful operational insights from your log data.
Exporting AWS CloudWatch logs to Apica
1. Apica CloudWatch Exporter Lambda function
2. Running Logstash on a VM (or Docker)

Method 1: Apica CloudWatch Exporter Lambda Function
Step 1: Creating a Lambda Function
apica.io provides CloudFormation templates to create the Apica CloudWatch exporter Lambda function.
You can Choose the appropriate CloudFormation template based on the type of logs you want to export:
Exporting Lambda Function logs
https://Apicacf.s3.amazonaws.com/cloudwatch-exporter/Apica-cloudwatch-lambda-logs-exporter.yaml
Exporting CloudTrail Logs
https://Apicacf.s3.amazonaws.com/cloudwatch-exporter/Apica-cloudwatch-cloudtrail-exporter.yaml
Exporting AWS VPC Flowlogs
https://Apicacf.s3.amazonaws.com/cloudwatch-exporter/Apica-cloudwatch-exporter.yaml
Exporting Cloudwatch logs from other services
Use the following CloudFormation template to export cloudwatch logs:
https://Apicacf.s3.amazonaws.com/cloudwatch-exporter/Apica-cloudwatch-flowlogs-exporter.yaml
This CloudFormation stack creates a Lambda function and its necessary permissions. However, you’ll need to configure the following attributes before using this template:
Parameter | Description |
|---|---|
APPNAME | Application name – a readable name for Apica to partition logs. |
CLUSTERID | Cluster ID – a readable name for Apica to partition logs. |
NAMESPACE | Namespace – a readable name for Apica to partition logs. |
ApicaHOST | IP address or hostname of the Apica server. (Without http or https) |
INGESTTOKEN | JWT token to securely ingest logs. Refer here to generate ingest token. |
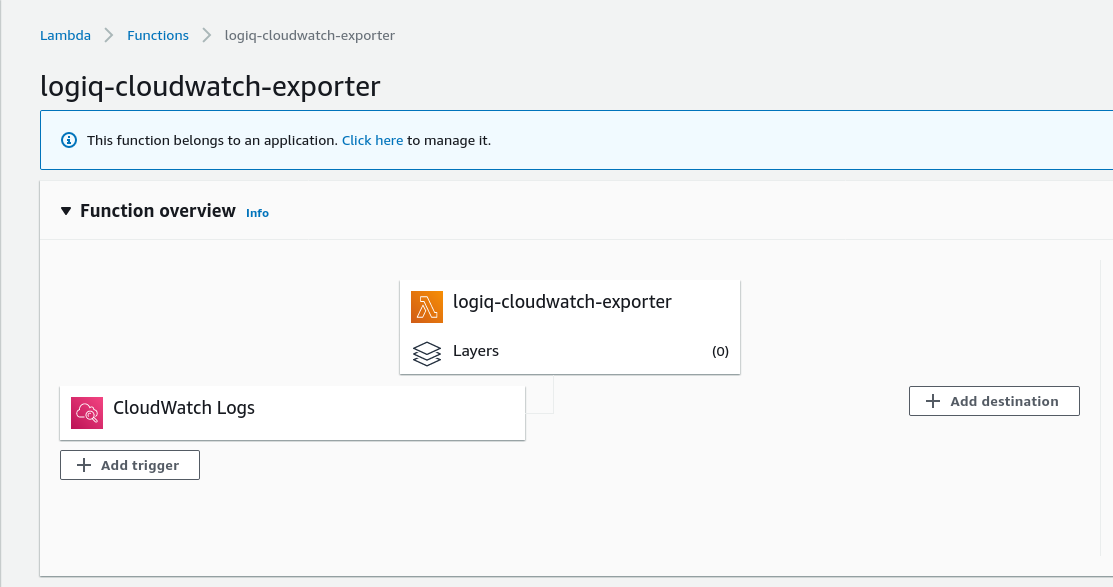
Step 2: Configuring the CloudWatch Trigger
- After the CloudFormation stack is created, go to the AWS Lambda function (Apica-cloudwatch-exporter) in the AWS Management Console.
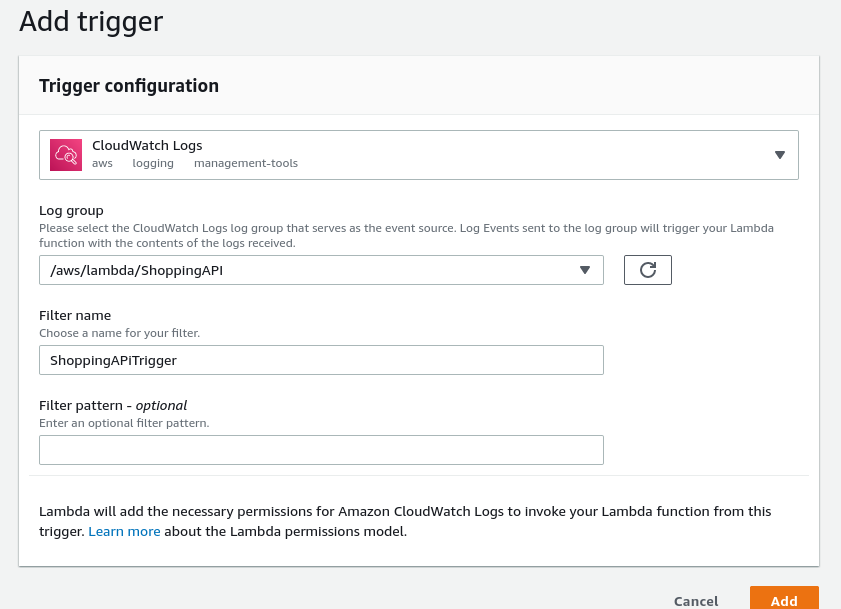
- Add a trigger to the Lambda function by clicking on the “Add trigger” button.
- Select “CloudWatch” as the trigger type.
- Choose the desired CloudWatch Logs Log Group to forward to Apica.
- Save the trigger configuration.
Method 2: Running Logstash on a VM (or Docker)
Step 1: Create the Logstash VM (or Docker)
					wget -qO - https://artifacts.elastic.co/GPG-KEY-elasticsearch | sudo apt-key add -
echo "deb https://artifacts.elastic.co/packages/6.x/apt stable main" | sudo tee -a /etc/apt/sources.list.d/elastic-6.x.list
sudo apt-get update
sudo apt-get install logstash
Step 2: Install Logstash Input Plugin for CloudWatch
cd /usr/share/logstash
sudo -u root sudo -u logstash bin/logstash-plugin install logstash-input-cloudwatch
Step 3: Configure Logstash
					input {
  cloudwatch_logs {
    access_key_id => "<Acess-key>"
    secret_access_key => "<secret-access-key>"
    region => "<region>"
    "log_group" => ["<Cloud-watch-log-group"]
    "log_group_prefix" => true
    codec => plain
    start_position => end
    interval => 30
  }
}

filter {
        ruby {
           path => "/home/<custom-path>/flattenJSON.rb"
           script_params => { "field" => "cloudwatch_logs" }
        }

	mutate {

           gsub => ["cloudwatch_logs.log_group","\/","-"]
           gsub => ["cloudwatch_logs.log_group","^-",""]
	   add_field => { "namespace" => "<custom-namespace>" }
	   add_field => { "cluster_id" => "<custom-cluster-id>" }
	   add_field => { "app_name" => "%{[cloudwatch_logs.log_group]}" }
	   add_field => { "proc_id" => "%{[cloudwatch_logs.log_stream]}" }
        }
}


output {
 http {
       url => "http://<Apica-endpoint>/v1/json_batch"
       headers => { "Authorization" => "Bearer <SECURE_INGEST_TOKEN>" }
       http_method => "post"
       format => "json_batch"
       content_type => "json_batch"
       pool_max => 2000
       pool_max_per_route => 100
       socket_timeout => 300
      }
}
You can obtain an ingest token from the Apica UI as described here.
Moreover, you can customize the namespace and cluster_id in the Logstash configuration based on your needs.
Conclusion
In conclusion, forwarding CloudWatch logs to Apica can be accomplished through two methods: using the Apica CloudWatch Exporter Lambda function or running Logstash on a VM or Docker.
The first method involves creating an AWS Lambda function and configuring a CloudWatch trigger to stream logs to Apica.
The second method requires installing Logstash on a VM or Docker, configuring it with the necessary settings, and leveraging the Logstash Input Plugin for CloudWatch. Both methods enable seamless forwarding of AWS CloudWatch logs to Apica, allowing you to efficiently manage and explore your logs within the Apica interface.
Choose the method that best suits your needs and follow the step-by-step instructions provided to get started with forwarding your CloudWatch logs to Apica.