Although AWS CloudWatch and X-Ray provide some logging capabilities, they have specific and limited use cases and may not be suitable for all types of log analysis and monitoring requirements.
CloudWatch primarily focuses on collecting and analyzing metrics and logs from AWS resources, such as EC2 instances, Lambda functions, and other services. While CloudWatch can also collect custom logs from other sources, it does not provide the same level of flexibility and customization options as a dedicated log management platform like Apica.
X-Ray, on the other hand, is a distributed tracing service that helps developers identify and diagnose issues in microservices-based applications.
AWS X-Ray essentially gathers information about the requests that your application serves and offers features that enable you to examine, refine, and understand that information. By leveraging X-Ray, you can detect problems and pinpoint opportunities to optimize your application’s performance.
While X-Ray can capture log data for troubleshooting purposes, it is not designed to be a comprehensive log management platform. This is where Apica’s log management capabilities come to the rescue.
What is Amazon CloudWatch?
Amazon CloudWatch is a powerful tool that allows you to monitor all your AWS resources and applications in real time. With CloudWatch, you can easily collect and track various metrics that help you measure and analyze the performance of your resources and applications.
CloudWatch provides comprehensive visibility into resource usage, application performance, and operational health across your entire system.
To access CloudWatch, you have several options available, including:
- Utilizing the Amazon CloudWatch console by visiting: https://console.aws.amazon.com/cloudwatch/
- Making use of the AWS CLI by following the setup instructions found in the AWS Command Line Interface User Guide.
- Leveraging the CloudWatch API by referencing the Amazon CloudWatch API Reference.
- Taking advantage of AWS SDKs, which can be found and downloaded from the Tools for Amazon Web Services page.
How to set up Amazon CloudWatch
To enable querying, monitoring, analyzing, and visualizing CloudWatch metrics in Apica, the service utilizes the boto3 client in conjunction with the AWS CloudWatch data source. It provides a natural syntax for querying the metrics.
However, before accessing the CloudWatch data, authentication credentials must be set up. These credentials are available in the IAM Console, where an existing user or a new one can be created. To set up the authentication credentials, navigate to the “manage access keys” section and generate a new set of keys.
Adding Amazon CloudWatch ( YAML ) data source
To add an Amazon CloudWatch data source in YAML format, you should follow these steps:
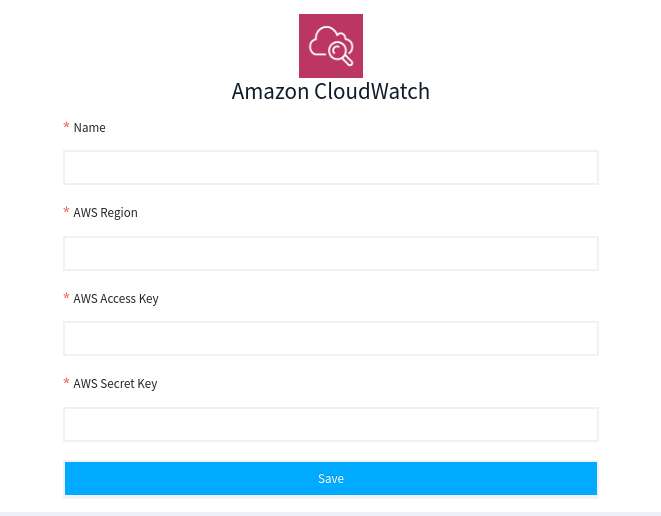
1. Begin by creating the data source, which entails providing the necessary information, such as the Name, AWS Region, AWS Access Key, and AWS Secret Key.
2. The Name field should reflect the intended name of the data source.
3. In the AWS Region field, enter the region associated with your AWS account.
4. For the AWS Access Key field, you should provide the access_key_id linked to your IAM Role.
5. For the AWS Secret Key field, provide the secret_access_key associated with your IAM Role.
If you wish to learn further on the steps for Querying CloudWatch head over to:
https://docs.apica.io/data-sources/aws/amazon-cloudwatch-yaml#:~:text=CloudWatch%20data%20source-,Querying%20CloudWatch,-These%20instructions%20assume
What is AWS X-Ray?
AWS X-Ray is like a superhero that keeps track of all the requests your application receives and gives you a set of tools to make sense of it all. You can filter and analyze this data to spot any issues and opportunities for improvement. Think of it as a superpower for any traced request to your application.
You not only get details about the request and response, but also about all the calls your application makes to other AWS resources, databases, web APIs, and microservices. It’s like having a secret weapon that lets you see the whole picture and make informed decisions about how to optimize your app.
In other words, AWS X-Ray is a distributed tracing service that allows you to see the interactions between the various components of your application, helping you to identify and troubleshoot issues more quickly.
While AWS X-Ray is an excellent tool for monitoring and analyzing the performance of your applications, it has its limitations when it comes to managing logs. This means that if you need to manage, search, and analyze logs from multiple sources, X-Ray alone may not be enough.
This is where Apica comes in. With apica.io, you can easily collect, store, search, and analyze logs from various sources, including AWS services, applications, and operating systems. This makes it easier for you to identify issues and troubleshoot problems in your application.
Apica also has advanced capabilities for log analysis, including machine learning algorithms that can help you identify patterns and anomalies in your log data. Moreover, you can also set up alerts and notifications to keep you informed of important events or issues in your application.
Conclusion
While CloudWatch and X-Ray offer basic logging capabilities for AWS resources, Apica provides a more comprehensive log management solution for organizations that require in-depth monitoring, analysis, and visualization of logs from various sources.
With Apica, enterprises can centralize log data, including those from non-AWS resources, and use our advanced search and visualization features to identify issues, troubleshoot problems, and optimize the infrastructure.
Therefore, incorporating Apica into your logging and monitoring strategy can greatly enhance your operational efficiency and help you achieve better visibility and control over your entire infrastructure.


