Log Management tools are crucial for the security and performance of your IT infrastructure. With the right log management system, you can quickly detect and respond to any anomaly or performance issue.
Presently, there are numerous log management platforms. Each with its own unique set of features and benefits. While most of these platforms offer industry-standard capabilities, what sets them apart from each other are the stand-out features, pricing, and overall user experience.
In this comprehensive guide, we’ll explore the top 10 log management platforms currently. We’ll draw a wider picture by highlighting the benefits and exceptional features of each platform.
Why do Log Management Tools matter?
For starters, Logs are the backbone of troubleshooting, performance analysis, health monitoring, and ensuring the integrity and security of applications.
In addition to essential information about the overall health of applications, logs contain a wealth of additional data that is not readily available otherwise.
Log management tools have a deep understanding of user interactions with apps and systems, providing valuable insights for enhancing:
- Software reliability
- Increasing productivity
- Mitigating risks
- Enhancing the user experience
That being said, log management tools enable you to integrate and enhance all your logs, leading to faster and more effective queries.
Key Metrics Used
This list is based on some key technical and business metrics, including-
- Scalability: the ability to handle log volumes and data growth effectively.
Log Collection and - Aggregation: Assess flexibility and ease of integration for collecting logs from various sources.
- Search and Analysis Capabilities: Examine query speed, advanced analytics, and correlation features.
- Visualization and Reporting: Evaluate customizable visualizations, dashboards, and report generation.
Alerting and - Notification: Look for configurable alerts and integration with notification systems.
Security: Consider encryption and access controls. - Compliance: How easy is it to meet compliance and audit?
Integration and APIs: Assess integration capabilities and availability of well-documented APIs. - Ease of Use and User Experience: Evaluate the user interface and overall user experience.
Support and - Documentation: Consider available support resources and documentation.
- Total Cost of Ownership: Assess the overall cost, including licensing, storage, and additional expenses.
- Data Ownership: How much data control does the user have?
- Data Openness: How much data visibility does the platform have?
- Interoperability: Is it operable across multiple platforms and integrations?
The Top 10 Log Management Tools in 2023
1. apica.io
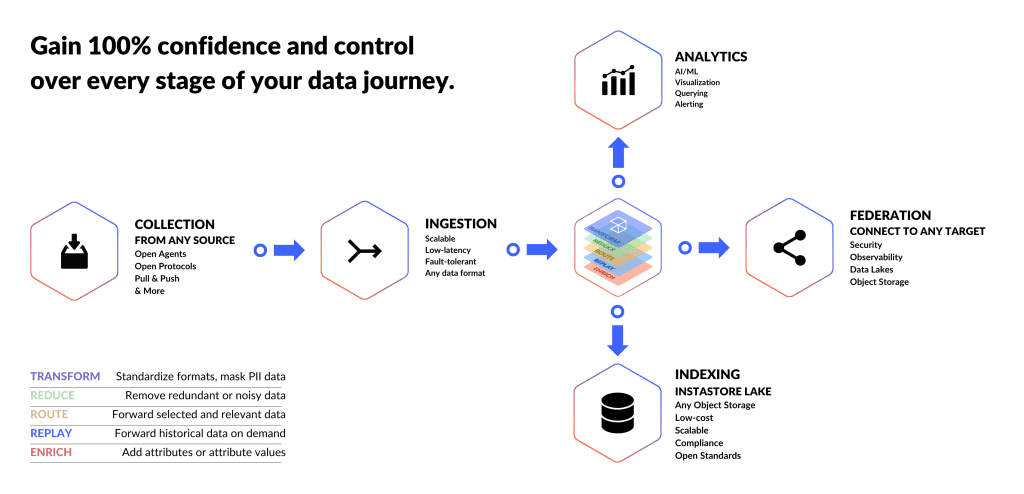
apica.io offers an all-encompassing array of features for Active observability. With its Operational Data Fabric architecture, Apica enables businesses to collect, process, and analyze data from various sources in real-time.
It offers real-time threat detection and response capabilities, allowing you to quickly identify and respond to security threats. The platform also provides comprehensive analytics tools for deriving insights from logging data.
Additionally, Apica includes a built-in HDS for gathering log-based security events, vulnerability information, malware data, and file alteration monitoring.
Not to mention that Apica also offers integrations with third-party applications to provide meaningful context and streamline incident response.
When it comes to Log Management, Apica is simply THE best low-cost log management tool.
With Apica’s log management system and strategy, you can gain invaluable insights into the inner workings of your systems. It allows you to monitor their health in real-time and make informed decisions for maximum operational efficiency.
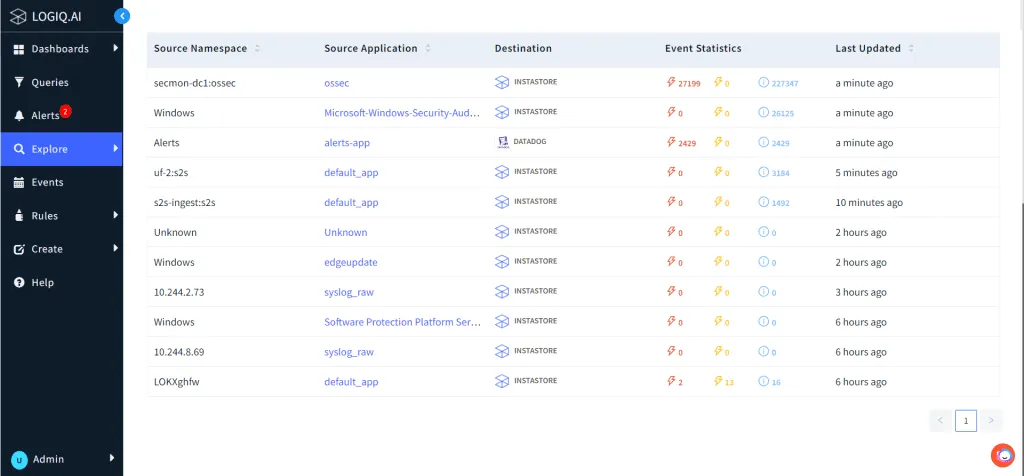
Apica’s log management and aggregation tool facilitates collecting, optimizing, analyzing, routing, and managing log data across your entire system, regardless of its size. It simplifies the process of constructing an observability data lake and provides a one-stop solution by consolidating all logs in one place.
Salient Features:
- Log2Metrics: Transform complex raw log data into time series metrics for visualization and plotting using various chart and graph types. Create custom indices and set up alerts for events.
- Automated Topology: Pinpoint issues through correlating logs, identifying anomalies, providing real-time alerts, and creating visualizations for efficient issue resolution.
- InstaStore: Store all log data in any object storage with real-time capabilities, eliminating tiering complexities and storage operations overhead. Fully indexed, searchable, mineable, comparable, and replayable to any target system in real-time.
- Fuss-free log collection: Collect and centralize logs across your entire stack, whether on-premises or in the cloud.
- Rule Packs: Leverage built-in Rule Packs to parse, process, cleanse, and optimize log data in motion for better data value.
- AI-driven pattern detection: Automatically detect patterns in logs and reduce them to unique patterns for root cause analysis.
- OpenTelemetry Integration: Implement automatic retention tiering to object storage with OpenTelemetry Integrations.
- Live log stream tailing: Debug production issues faster by tailing live log streams from the user interface.
- Simple search and filtering: Perform plain text searches or complex regex queries with chained logical operators.
- Alerting and Integrations: Generate alerts based on specific log events or patterns and integrate them with other systems.
- Audit and compliance readiness: Unify log data from various sources, maintain audit trails, and generate comprehensive reports for audit and compliance purposes.
Apica Amongst Log Management Tools
Apica stands out as the preferred log management solution due to its cost-effectiveness, scalability, comprehensive features, customizability, compliance capabilities, AI-driven troubleshooting, data ownership, and flexibility of deployment.
To put things into perspective, the following are some key benefits you get with the platform:
1. Cost-effective, impactful log management solution.
2. Limitless scalability for any volume of log data.
3. Comprehensive feature set tailored to your needs.
4. Easy customization to fit your specific requirements.
5. Unlimited time-travel access to historical log data.
6. Search and analyze every log without archiving.
7. Simplified compliance with retention and PII masking.
8. Long-term log retention, ensuring data availability.
9. AI-powered troubleshooting for fast issue resolution.
10. Full data ownership, deploy anywhere, zero lock-ins.
11. AI/ML-driven analysis, zero blind spots, automatic topology.
Hold on, that’s not all. The full-features list for Apica’s log management capabilities is extensive. You can explore it here in detail.
2. Splunk
Splunk is one of the most powerful log management tools that provide real-time analytics and insights from both structured and unstructured data. It helps to diagnose, troubleshoot, and investigate any security issues or threats.
Designed for enterprise customers in need of rapid access to search, diagnostic, and reporting tools for data logs, Splunk offers a comprehensive log management tool.
Alongside Splunk Infrastructure Monitoring, the platform integrates Splunk RUM, APM, and On-Call functionalities. This cloud-based log observability solution provides enterprise billing options and is fully equipped to handle substantial volumes of data logs.
Salient Features:
- Smartly engineered solutions for businesses.
- A powerful query language for in-depth analysis and search.
- Alert monitoring system for tracking crucial events.
- Integrated real-time search, analysis, and visualization of data.
Integrated dashboard view for better visualization.
Additional information about Splunk:
- Cross-platform log management solution for macOS, Linux, and Windows.
- Renowned utility in the system administration community.
- Offers different versions, including Splunk Enterprise for network data monitoring.
- Can accept logs and provides security options.
- Data search utility and analysis capabilities.
- Free version available for input file analysis but with limitations on users and data throughput.
- Specialist packages available, such as SIEM and workflow automation systems.
Note: While Splunk is a powerful data analyzer, it requires additional configuration to function effectively as a log manager.
Moreover, the TCO with Splunk can ascend quickly once the volume of logs increases and as you scale your infrastructure.
Furthermore, while the ease of implementation may vary based on specific needs, Splunk’s capabilities make it a reliable solution for meeting compliance and audit obligations.
3. Datadog
Datadog uses a distributed architecture for data collection. The lightweight agent collects metrics, events, and logs. Data is then processed and analyzed in real-time.
It collects Logs from a host of sources and stores them in a scalable format. Datadog offers a powerful query language for log analysis.
Additionally, it has integrations with popular logging frameworks. Datadog provides monitoring and analytics features for infrastructure, APM, tracing, and synthetic monitoring. Furthermore, it offers comprehensive visibility and helps optimize systems.
Salient Features:
- Centralized log collection from various sources.
- Real-time log processing for immediate analysis and monitoring.
- Powerful search functionality for quick log retrieval.
- Log analytics and visualization through interactive dashboards.
- Correlation and alerting for anomaly detection.
- Long-term log retention and archiving.
- Seamless integration with monitoring and APM.
- Security features and compliance reporting.
- Collaboration and sharing capabilities.
- Scalable and flexible to handle high log volumes and diverse formats.
More on Datadog’s Log Management:
- Log Collection: Gather logs produced using the Syslog standard in Linux and Windows Event messages.
- Consolidation: Centralize log data from diverse sources to simplify accessibility and analysis.
Application Log - Management: Effectively handle and examine logs from multiple applications.
- Archiving and Retrieval: Store logs for extended periods and easily access archived logs when required.
- Log File Administration: Streamline the management and organization of log files.
While Datadog’s log management solution offers robust features and capabilities, it may not fit every organization perfectly. Factors such as cost, complexity, scalability, specific use cases, and alternative preferences can influence its suitability.
Therefore, evaluating specific requirements and exploring alternatives is prudent before committing to Datadog’s log management solution.
4. Logz.io
Logz.io is one of the top log management tools that leverages machine learning and predictive analytics to simplify the process of identifying critical events and analyzing log data from various environments. It is a cloud-based SaaS platform built on ELK Stack (Elasticsearch, Logstash, and Kibana) that offers real-time insights into log data.
Salient Features:
- ELK Stack as a Service: Analyze logs in the cloud using the powerful ELK Stack.
- Cognitive Analysis: Identify critical log events before they impact production using advanced cognitive analysis capabilities.
- Quick Setup: Get up and running in just five minutes, enabling rapid deployment to production.
- Dynamic Scaling: Scale the platform dynamically to accommodate businesses of all sizes.
- AWS-Built Data Protection: Benefit from robust data protection measures built by AWS to ensure the security and integrity of your log data.
Additional Features:
- Log Shipping Options: Logz.io offers versatile log shipping options including SDKs, log shipping demos, and cloud integrations, particularly with AWS, making it convenient to leverage Logz.io with your application.
- Comprehensive Documentation: The platform provides helpful documentation that effectively addresses any confusion or uncertainty, ensuring a smooth user experience.
- Terraform Integration: Offers a limited Terraform provider for their platform, allowing users to easily manage and provision cloud resources using Terraform.
- Built-in Parsers: Pre-built parsers for popular applications like Nginx or MySQL, eliminating the need to develop custom parsers, and saving time and effort.
5. Graylog
Graylog is among the powerful open-source log management tools that enable the centralized collection, processing, and analysis of log data. It provides a comprehensive solution for aggregating logs from various sources, such as servers, applications, network devices, and more.
Salient Features:
- Real-time log streaming: Stream log data in real-time to analyze database and web server failures within a single stream. Trigger alerts based on new items or threshold exceedance.
- Latency reduction with streams: Address latency concerns by using user-defined rules to add, remove, update, or drop messages in real- time.
- Trend and anomaly analysis: Identify trends and anomalies within log data for proactive monitoring and troubleshooting.
- Timely alerts and actions: Set up alerts for specific log events or conditions to receive notifications and take prompt actions.
- Automated management and compliance: Automate log management and compliance tasks for streamlined operations.
- Enhanced visibility across IT infrastructure: Centralize log data for improved visibility and monitoring across the entire IT infrastructure.
Other Features:
- Log consolidation: Graylog consolidates logs from various sources, including Windows Events, Syslog, and application logs, into a common format.
- Query language and SIEM capabilities: Developers can use Graylog’s query language to create a SIEM system on top of the Graylog service. Pre-written SIEM packages are also available for purchase.
- Throughput statistics and live log display: Displays real-time statistics on log message throughput and provides a live view of log records as they arrive and are filed.
- Log file management: Effectively handles log file management by organizing logs into a structured directory system and automatically rotating log files on a daily basis.
- Log analysis and viewer: Log files can be analyzed using the data viewer, which includes features such as sorting, grouping, and filtering.
- Customizable performance monitoring: Users can set up custom performance monitoring screens using templates and widgets provided by Graylog.
- Security Monitor package: Graylog’s Security Monitor includes pre-written templates for various detection scenarios. It can be integrated with SOAR systems to gather detailed activity information and take automated actions such as suspending accounts or blocking specific IP addresses.
6. Coralogix
Coralogix Log Management is a comprehensive platform designed to simplify and optimize the process of managing and analyzing log data.
Salient Features:
- Real-time predictive analysis and advanced algorithms for deep operational insights
- Parsing rules for transforming, structuring, and masking log data
- Dynamic alerting and automated detection of critical events
- Swift log aggregation and clustering for enhanced analytics
- Direct use of Elasticsearch syntax to query archived data
Reindexing capability for further analysis - Efficient log monitoring and storage
- Anomaly detection to minimize false positives
- Query Archive & Reindexing for infinite log data retention
- Simplified process of parsing, transforming, and enriching logs
Additional Features:
- Stateful Insights and Real-time Alerting: Coralogix’s stream components provide real-time alerting and stateful insights without requiring data indexing, ensuring seamless observability.
- Remote Data Archiving: After ingestion, parsing, and enrichment, data is remotely written to a client-controlled archive bucket. Users have infinite retention and can query the archive directly from the platform UI or CLI.
- Flexible Data Viewing and Querying: Coralogix allows users to view and query their data from any dashboard using any syntax, enabling effortless data exploration and analysis.
- Compliance with Security and Privacy Standards: Coralogix has achieved compliance with GDPR, SOC 2, PCI, HIPAA, and ISO 27001/27701, ensuring data security and privacy adherence.
7. Elastic
ELK, also known as the Elastic Stack, is one the most powerful and scalable log management tools that combine three open-source tools: Elasticsearch, Logstash, and Kibana.
It offers a comprehensive set of features for collecting, processing, analyzing, and visualizing log data.
Salient Features:
- Log Ingestion: Centralized collection of logs from various sources using Beats, Logstash, or direct API integration.
- Distributed Architecture: Scalable and fault-tolerant architecture with data distribution across multiple nodes in a cluster.
- Near Real-time Indexing and Searching: Immediate availability of log data for search and analysis.
- Full-text Search and Querying: Powerful query DSL supporting full-text search, filtering, aggregations, and sorting.
- Aggregations and Analytics: Summarization, statistical calculations, and visualizations for log data analysis.
- Integration with Kibana: Seamless integration with Kibana for interactive log data visualization and exploration.
- Security and Access Control: SSL/TLS encryption, authentication, and authorization mechanisms for secure log data handling.
- High Availability and Resilience: Data replication and failover mechanisms for ensuring availability and resilience.
Additional Features:
- Application Dependency Insights: Insights into application dependencies and vulnerabilities to ensure robust performance.
- Fast Log Searching: Quick retrieval of JSON documents based on keyword or attribute searches within log files.
- Proactive Monitoring with Watchers: Create events and set up alerts for proactive monitoring, triggering actions like Slack notifications.
- Time-saving Keyword Search: search Kubernetes cluster log files using keyword search within seconds.
- Kibana Integration: Seamless integration with Kibana for log monitoring, alerting, and error searching.
8. NewRelic
New Relic collects real-time insights and trending data on infrastructure performance to enhance resilience and deliver good customer experiences.
New Relic offers a comprehensive, unified platform that includes a secure telemetry cloud for metrics, events, logs, and traces. It also provides robust Active analysis tools and predictable user-based pricing, all delivered as a seamless and integrated experience.
Salient Features:
- Real-time metrics and logs facilitate effective monitoring and analysis, particularly valuable for messaging and real-time applications.
- Efficiently gathers and analyzes data from web-based applications, enterprise applications, and databases, providing valuable insights and statistics for proactive decision-making.
- User-friendly and intuitive platform with easy installation and setup of agents or data submission via API.
- Comprehensive visualizations and performance information for effective debugging and transaction trail access.
- Supports a wide range of use cases with APIs and integrations, offering better observability and informed decision-making.
- Real-time insights into application, server, and database performance for quick issue identification and troubleshooting.
- Seamless integration with Java-based projects, particularly spring boot applications, with secure monitoring through TLSv1.2 support.
Additional Features:
- Apdex incident reports aid in identifying performance degradation issues, especially after deployments or site changes.
- The Synthetics feature enables the automation of uptime checks and scheduled jobs/tests.
- Integration options are available with many hosting partners for added convenience.
- Improved visibility into applications and infrastructure, facilitating efficient monitoring and analysis.
- Provides a simple installation process for quick deployment and start-up.
- Delivery tracking captures the impact of application or configuration changes, providing insights into the performance before and after modifications.
- Seamless integration with other enterprise tools through various connectors saves time and effort.
- Active observability enables quick issue identification and resolution across equipment, applications, and end-user experience.
- Customizable dashboards and views for personalized monitoring and filtering.
9. Sumo Logic
SumoLogic is a cloud-based SaaS analytics platform that leverages logs to assist customers in building and maintaining reliable and secure cloud-native applications.
Sumo Logic offers application reliability, enhanced security measures against modern threats, and valuable insights into cloud infrastructures.
Salient Features:
- Rapid Data Processing: Eliminates the need for additional tools, ensuring quick problem identification and resolution.
- Cloud Visibility: Gain visibility into cloud-based services like AWS, Azure, GCP, and third-party platforms for proactive monitoring and visibility.
- Live and Interactive Dashboards: Real-time data is presented in the live dashboard, while the interactive dashboard allows in-depth analysis, trend identification, and event filtering.
- Advanced Analytics: Leverage algorithms and machine learning for advanced analytics, identifying patterns, anomalies, and exceptions in log data.
- Efficient Query Language: Perform complex searches and extract specific information from log data using Sumo Logic’s efficient query language.
- Centrally Managed Agent System: Simplify log collection agent deployment and management across different environments with the centrally managed system.
- High-Resolution Metrics: Monitor and analyze performance at a granular level with high-resolution metrics.
Additional features:
- Log Collection and Management: Simplified aggregation and management of log data from various sources for efficient infrastructure monitoring.
- Powerful Search and Analytics: Advanced capabilities for quick insights through complex queries and data filtering.
- Real-time Monitoring and Alerting: Proactive anomaly detection and instant alerts for prompt action and reduced downtime.
- Scalable Cloud-Native Architecture: Flexible and scalable architecture to handle growing log data volumes and adapt to changing business requirements.
- Security and Threat Analysis: Analyzing machine log data to ensure application reliability and protect against evolving cybersecurity threats.
- Monitoring Dashboards and Easy Integrations: Intuitive dashboards and seamless integrations for easy access to critical insights and faster issue identification.
- Excellent Support and Constant Innovation: Superior support, comprehensive documentation, easy deployment, and continuous innovation.
- Seamless AWS Integrations: Simplified integration with AWS to enhance data accessibility and usability.
10. Sematext
Sematext Cloud is an integrated platform that offers solutions for monitoring infrastructure, application performance, log management, real user behavior, and synthetic monitoring.
Salient Features:
- Elasticsearch API access: Sematext Logs exposes the Elasticsearch API, so you can run searches, export data, create custom templates, and more.
Agent-free: Sematext Logs is agent-free, so you can send logs from any source, format, or location. - Role-based access control: Sematext Logs supports role-based access control, so you can control who has access to which logs.
- Alerting: Sematext Logs can send alerts based on thresholds, trend-based conditions, and other complex searches.
- Anomaly detection: Sematext Logs can detect anomalies in your logs, so you can identify potential problems before they cause outages.
- Integrations: Sematext Logs integrates with a wide range of third-party tools, so you can get the most out of your log data.
Additional Features:
- Customizable Alerts: Easily configure and customize alerts based on your specific requirements and receive notifications through various platforms.
- User-Friendly Interface: Sematext’s modern and intuitive user interface makes it easy to navigate and understand your log data.
- Predictable Pricing: With a transparent pricing model, you can accurately predict and manage your monthly costs.
- Documentation and Support: Sematext offers well-explained documentation and responsive support, ensuring a smooth user experience.
- Remote Log Monitoring: Fetch logs from remote endpoints, providing detailed information about compute, storage, Kubernetes, containers, and more.
- Scalable Plans: Choose from different plans to accommodate your needs, with options to upgrade as your requirements grow.
The Verdict on Log Management Tools
Log management is a dynamic landscape that continuously evolves with advancements in technology, changing business requirements, and emerging trends in data analysis and security.
Organizations generate an immense volume of log data from different sources, such as servers, networks, databases, cloud services, and applications. Log management tools play a crucial role in handling this data effectively to derive insights, identify issues, troubleshoot problems, and ensure the overall health and performance of IT infrastructures.
As the volume and complexity of data continue to grow, logging plays a crucial role in addressing issues that cannot be resolved through communication and time-consuming investigations alone. It enables swift identification of problem sources, facilitating prompt resolutions and preventing their recurrence.
With hundreds of products in the industry already, this comprehensive list of the top 10 log management tools aims to clear the muddy waters.
What platform is your organization using for effective log management? What features hold the utmost importance for you? Would you consider apica.io? Share your views in the comments section.


