Microservices architecture has become increasingly popular in modern software development due to its scalability, resilience, and flexibility. However, with the benefits of microservices come the challenges of debugging and monitoring these distributed systems.
Using the Istio service mesh, OpenTelemetry distributed tracing, and Apica’s Kubernetes-native
observability platform, developers can easily collect and visualize performance data in real-time
to identify and fix issues quickly.
Setting Up Istio for Tracing
Istio, a powerful service mesh for Kubernetes, provides traffic management capabilities and can also generate traces to offer visibility into both Istio and application behavior. However, one limitation is that Istio can only collect partial data with partial context.
In simpler terms, while Istio can create spans to trace service interactions, it might struggle to correlate spans across multiple services seamlessly. This limitation prevents Istio from accurately connecting the dots between microservices interactions. To overcome this hurdle and attain a comprehensive overview of transaction flows, it’s essential to instrument each microservice to extract the context propagated by Istio. This context must then be injected into downstream services.
This can be achieved through two primary approaches:
- Manual Instrumentation: Utilize the OpenTelemetry SDK to manually integrate your
microservices with Istio. This involves adding code to your services to extract and
propagate context data, allowing Istio to better piece together the trace. - Automatic Instrumentation: Employ the OpenTelemetry Operator, a Kubernetes-native
solution that automates the instrumentation process. This streamlines the integration
and minimizes the manual effort required.
Leveraging OpenTelemetry for Enhanced Tracing

OpenTelemetry addresses the intricate challenges of tracing in distributed systems. It provides APIs, libraries, agents, and instrumentation tools to enhance observability in applications. By seamlessly integrating OpenTelemetry with Istio, you can achieve more precise tracing and improved context propagation across microservices.
A well-executed integration of OpenTelemetry with Istio significantly enhances the service mesh’s tracing capabilities.
The key benefits include:
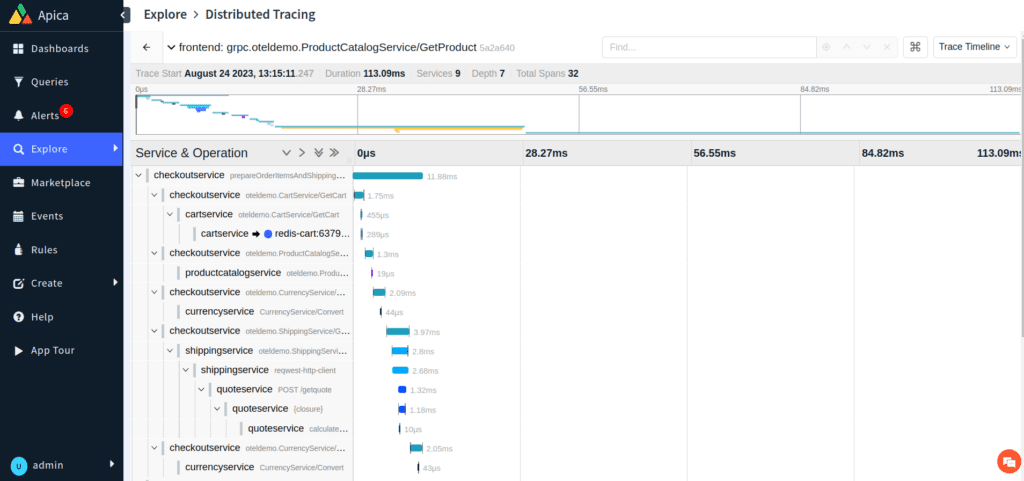
- Granular Tracing: OpenTelemetry offers more detailed tracing insights, enabling a finer understanding of microservices interactions.
- Context Continuity: Traces initiated by Istio are seamlessly continued as requests pass through various microservices. This ensures that the trace context remains intact throughout the journey.
- 360° View: The seamless continuation of traces allows developers to obtain a holistic perspective of request flows across the microservices landscape.
Apica: Orchestrating Microservices Performance
Apica’s key features and benefits include:
- Synthetic Transactions: Apica enables the setup of synthetic transactions, mimicking real user interactions. This proactive approach helps identify performance bottlenecks, slow responses, and potential downtime before they impact users.
- Realistic Simulations: Synthetic transactions replicate real-world user interactions, allowing you to test microservices under conditions closely resembling actual usage scenarios. This realism enhances the accuracy of performance assessments.
- Downtime Prevention: By continuously monitoring microservices’ health, Apica identifies slow responses and instability, helping to prevent potential downtime. Early anomaly detection enables timely corrective measures.
Jaeger and Storage Backend Options
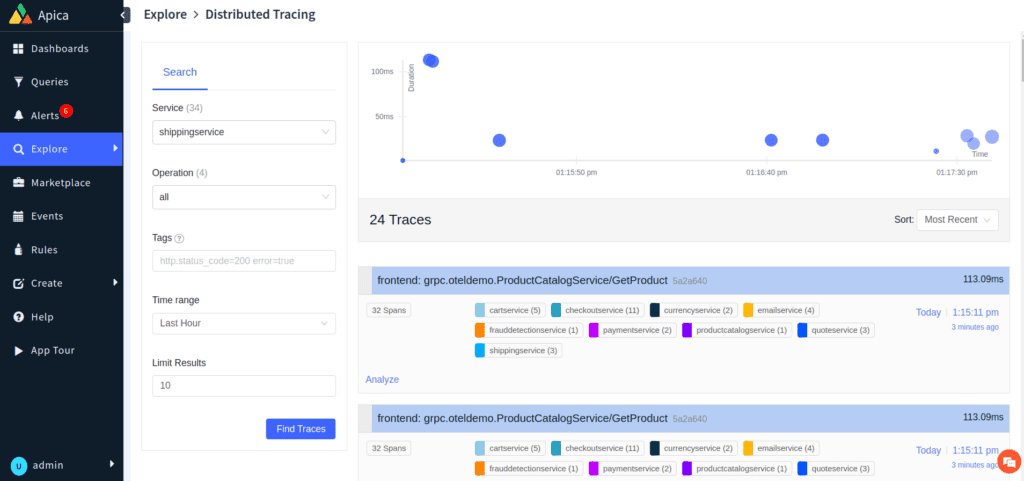
When implementing tracing with OpenTelemetry and Istio, you’ll often use a tracing backend to store and visualize the collected data. Jaeger is a popular open-source tracing platform that can be integrated with Istio to achieve this. It offers native support for two NoSQL databases, Cassandra and Elasticsearch, as storage backends for trace data.
However, it’s worth noting that while there are open-source projects that allow you to connect Jaeger with object storage solutions like AWS S3, these projects might not be actively maintained. This takes us to using Apica as a Tracing Backend.
Apica and Tracing Backend
Apica offers performance monitoring capabilities that complement tracing and observability in microservices architectures. When integrated into your system, Apica enables you to set up synthetic transactions that simulate real user interactions. This functionality provides several benefits, including:
- Proactive Issue Identification: Synthetic transactions allow you to proactively identify performance bottlenecks and issues in your microservices before they impact end users. By simulating different user interactions and workflows, you can pinpoint potential areas of concern and address them before they escalate into significant problems.
- Real-World Simulations: Apica’s synthetic transactions mimic real-world user interactions, enabling you to test your microservices in conditions that closely resemble actual usage. This approach ensures that you’re monitoring your services under realistic scenarios, improving the accuracy of performance assessments.
- Downtime Prevention: Through continuous monitoring, Apica helps prevent potential downtime by detecting slow responses and instability in your microservices. Early detection of anomalies allows you to take corrective measures before these issues impact your users’ experience.
- Data-Driven Insights: The data collected by Apica’s synthetic transactions provides valuable insights into the behavior of your microservices. By analyzing this data, you can make informed decisions about optimizing your architecture, improving resource allocation, and enhancing overall system performance.
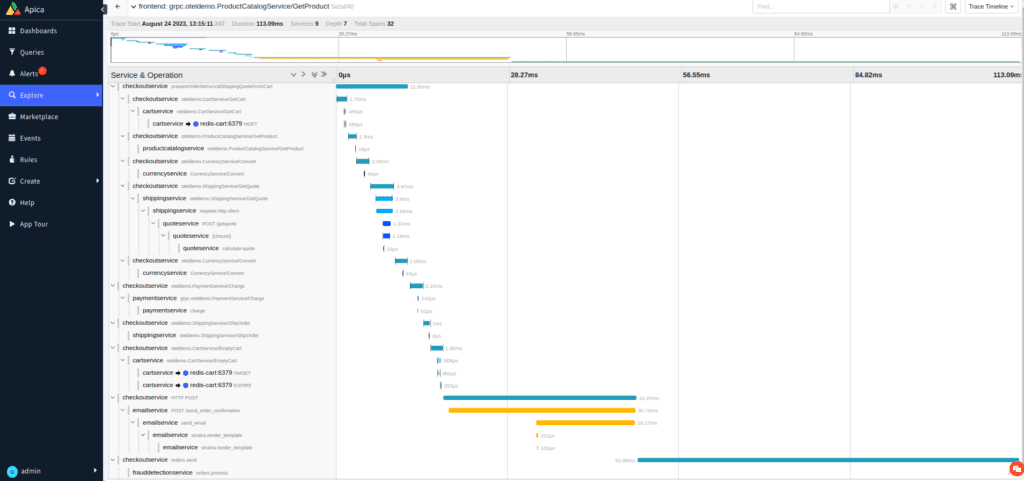
Additionally, in the context of Istio and OpenTelemetry-based tracing, Apica can serve as a complementary tool to enhance the overall observability of your microservices ecosystem:
- Comprehensive Observability: While tracing provides insights into the flow of requests and responses between microservices, Apica’s performance monitoring offers a broader perspective on the health and responsiveness of your entire system. Together, they offer a comprehensive view of your application’s behavior.
- Data Convergence: By correlating data from tracing and performance monitoring, you can gain a deeper understanding of how performance issues in one microservice might impact the interactions between different components. This correlation enables more effective troubleshooting and optimization.
- Enhanced Decision-Making: The combination of tracing and Apica’s performance monitoring data empowers you to make data-driven decisions about resource allocation, scaling, and architectural improvements. You can prioritize areas that need attention based on both trace data and performance metrics.
- End-to-End Insights: Apica’s synthetic transactions provide insights from an end-user perspective, which complements the technical details obtained from tracing. This holistic approach ensures that you’re not only addressing technical issues but also focusing on user experience.
In a Nutshell
In conclusion, debugging microservices in a Kubernetes environment requires a combination of tools and practices. Istio’s traffic management capabilities can be extended to provide tracing through integration with OpenTelemetry. This enables more comprehensive context propagation and trace continuity across microservices. To ensure optimal performance and responsiveness, Apica’s services can be employed for continuous performance monitoring.
Hence, by combining these tools and approaches, developers will be equipped with the necessary visibility to quickly identify and address potential issues in their Kubernetes environment.
In addition, this kind of debugging can improve efficiency in development and maintenance cycles, reducing downtime and enhancing overall service delivery. Thus, with comprehensive visibility into Kubernetes microservices enabled through these tools, developers have access to actionable insights that will enable them to deliver better quality services for the users.
In a Glimpse
Debugging microservices in Kubernetes can be challenging. Istio, OpenTelemetry, and Apica can be used together to provide comprehensive visibility into microservices, making it easier to debug them.
Specifically:
- Istio is a service mesh that can be used to manage traffic between microservices and collect tracing data.
- OpenTelemetry is an open-source project that provides a set of APIs and tools for collecting and exporting telemetry data.
- Apica is a monitoring platform that can be used to collect performance data from microservices.
By integrating Istio, OpenTelemetry, and Apica, you can get a complete picture of how your microservices are performing and identify any potential issues. This can help you to debug microservices more quickly and easily, improve their performance, and reduce downtime.