Prometheus, developed by SoundCloud, is a powerful open-source system for service monitoring and time series data storage. It collects metrics from configured targets, evaluates rule expressions, presents results, and triggers alerts based on defined conditions.
Thanos, on the other hand, is a collection of components designed to create a highly available metric system with limitless storage capacity. It can be seen as an advanced implementation of Prometheus, offering both high availability and long-term storage capabilities.
In the previous article in our HowTo series, we dived deep into the differences between Prometheus and Thanos.
In this article, we aim to demonstrate how to scale Prometheus with Thanos for long-term data retention.
Let’s quickly go over the key features of Thanos, which include:
- Seamless Integration: Seamlessly integrates with existing Prometheus deployments, leveraging the efficient storage format of Prometheus 2.0.
- Object Storage for Historical Data: Stores historical metric data in object storage, ensuring limitless scalability and durability for long-term data retention.
- Rapid Query Response Times: Maintains fast query response times, even when handling large volumes of data, enabling efficient data analysis and troubleshooting.
- Global Query View: Provides a centralized, global query view that spans all connected Prometheus installations. This feature allows for real-time data merging from high-availability Prometheus pairs, providing a comprehensive view of metrics across multiple instances.
- Prometheus High Availability: Ensures high availability for Prometheus by aggregating data from multiple instances and enabling centralized querying and monitoring.
- Long-Term Metrics Retention: You can easily retain metrics for an extended period, allowing for historical analysis and trend identification.
- Easy Backup: Simplifies the process of backing up metrics, ensuring data resilience and easy recovery in case of failures.
- Cross-Cluster Scalability: Enables seamless scaling across clusters, allowing you to handle increasing volumes of data without compromising performance.
- Cost-Effective Data Access: Provides affordable data access, allowing you to efficiently store and retrieve metrics without incurring excessive costs.
These features make Thanos a powerful companion to Prometheus, enhancing its scalability, reliability, and long-term data management capabilities.
Scaling Prometheus Metrics with Thanos
Thanos comes to the rescue as a “highly available Prometheus setup with long-term storage capabilities.” It solves the challenges faced when scaling Prometheus metrics.
- Thanos provides object storage for unlimited time, making it an ideal solution for storing and querying historical data.
- It effortlessly manages any duplicate metrics that might occur due to the presence of multiple Prometheus instances.
- It seamlessly aggregates data from multiple Prometheus instances, allowing you to query them from a single endpoint.
How Thanos is Used in Scaling Prometheus: Step-by-Step
1. Storage
- Thanos Sidecar: The Sidecar component of Thanos plays a crucial role in solving memory-related issues. It facilitates the seamless uploading of metrics as object storage on popular providers like S3, Swift, Azure, etc.
- StoreAPI: Thanos utilizes the StoreAPI as an API gateway, converting standard HTTP operations into gRPC format. It uses a small amount of disk space to keep track of remote blocks and ensure synchronization.
- Time-Based Partitioning: Thanos incorporates Time-Based Partitioning, allowing you to set flags that filter metrics from specific timeframes within the Store Gateway.
- Index Cache and Caching Bucket: Thanos features an Index Cache and implements a Caching Bucket, which enhances latency performance and facilitates the transition from read/write dependencies to cloud storage.
2. Sidecar Benefits
- Backup and Historical Data: The Sidecar is invaluable in case of an outage as it enables the retrieval of historical data through backups stored in the cloud. This ensures data integrity and prevents loss during unexpected events.
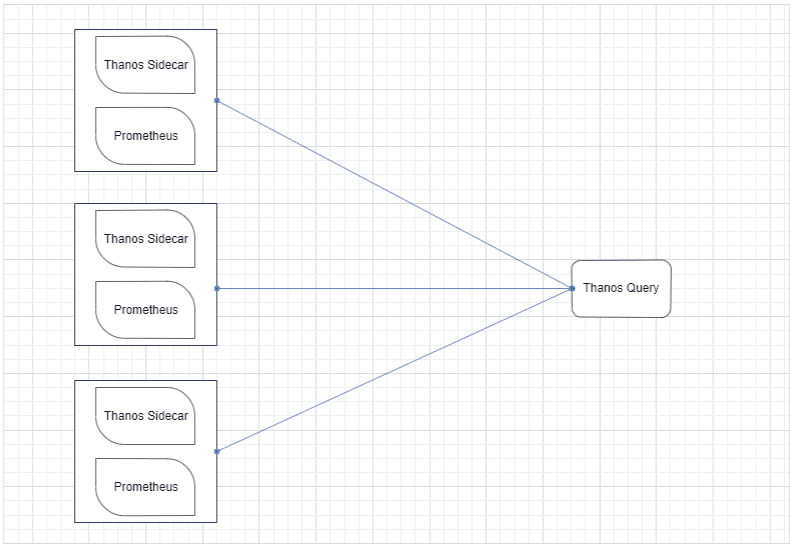
3. Basic Thanos Query
- Thanos Query Component: The basic Thanos setup includes the Thanos Query component responsible for aggregating and deduplicating metrics.
- Prometheus HTTP API: Thanos Query utilizes the Prometheus HTTP API to query data within a Thanos cluster using PromQL.
- Integration with StoreAPI: Thanos Query integrates with the StoreAPI to query underlying objects and retrieve results.
- Stateless and Horizontal Scalability: The Thanos querier is fully stateless and horizontally scalable, designed to handle large volumes of queries.
4. Scaling Thanos Query
- Multiple Thanos Query Nodes: To accommodate multiple Kubernetes clusters and Prometheus instances, Thanos Query nodes are deployed to aggregate subsets of Sidecar and Prometheus instances.
- Aggregating Thanos Query Nodes: Thanos Query nodes themselves can be aggregated, allowing a single node to handle multiple instances of Thanos Query nodes.
- Deduplication of Metrics: Thanos Query performs automatic deduplication of metrics, ensuring accurate and consistent results across multiple clusters.
5. Querying Prometheus Metrics Across Clusters
- Deduplication by Head Thanos Query Node: The head Thanos Query node efficiently handles the deduplication of metrics using high-performance algorithms.
- Single Query Node Advantage: The setup provides a single node to query all metrics, simplifying the querying process.
- Redundancy and High Availability: Enables queries against any cluster and ensures access to all metrics, minimizing data loss during downtime or service failures.
By implementing Thanos in Prometheus scaling, developers can achieve horizontal scalability, seamless storage integration, efficient querying, and redundancy across multiple clusters, ensuring reliable and scalable metric monitoring.
Apica provides a comprehensive solution for scaling Prometheus using Thanos, offering a seamless and hassle-free experience. With the Apica Stack, you can effortlessly organize and store logs, metrics, and traces in an object store, following a similar architecture to Prometheus and Thanos.
How apica.io helps in scaling Prometheus using Thanos
1. Simplified Configuration and Management:
Apica eliminates the complexities involved in configuring and managing Prometheus and Thanos yourself. Instead, you can leverage the Apica Stack, which provides a user-friendly interface and intuitive controls for easy setup and maintenance.
This saves valuable time and resources that would otherwise be spent on manual configuration and troubleshooting.
2. Unified Storage for Observability Data:
Apica integrates seamlessly with Prometheus/Thanos remote write functionality, allowing you to store logs, metrics, and traces in a centralized object store.
This unified storage approach simplifies data management and ensures that all your observability data is stored in a single, scalable platform. By consolidating data storage, Apica enhances efficiency and reduces the complexity of managing multiple storage systems.
3. Scalable Platform for Ingesting Observability Data:
Apica provides a scalable platform specifically designed for ingesting observability and machine data.
With its robust architecture, Apica Stack can handle high volumes of data generated by Prometheus and other data sources without compromising performance or stability. This scalability ensures that your Prometheus deployment can accommodate increasing data loads as your infrastructure grows.
4. Optimized Data Storage:
Apica gives you granular control over what data you store, allowing you to optimize storage based on your specific needs.
By providing configurable retention policies and intelligent data lifecycle management, Apica enables you to strike a balance between storage costs and the duration of data retention.
This flexibility ensures that you can efficiently manage your data storage while meeting compliance requirements and retaining critical data for analysis and troubleshooting.
Wrapping Up
Thanos is an essential component for effectively leveraging Prometheus at a large scale in a production setting. Its capability to deliver high availability while avoiding data duplication and offering a centralized view across clusters makes it indispensable.
Although there’s still work to be done, like support for horizontally scaled Prometheus clusters and more intuitive storage management features, Thanos is a powerful tool for monitoring your system at scale.
apica.io simplifies the process of scaling Prometheus with Thanos by offering a comprehensive platform for organizing, storing, and managing observability data. With Apica Stack, you can overcome the challenges of configuring and managing Prometheus and leverage the scalability and reliability of Thanos.


