Thanos and Prometheus are highly robust systems that offer fast and dependable monitoring capabilities. But what makes each system different?
Prometheus is a time-series database and monitoring tool created by SoundCloud in 2012. It allows users to store collected metrics data as well as generate alerts when certain conditions are met. Prometheus also offers a powerful query language for creating sophisticated queries and metrics.
Thanos is an open-source monitoring system created in 2017 that combines the power of Prometheus with distributed storage and high availability to effectively scale its monitoring capabilities.
It also provides additional features like global query view, high availability, and affordable access to historical data in a single binary. It also supports deduplication and block-level compression.
In this article, we’ll uncover the differences between Prometheus and Thanos and explore how to leverage Thanos to scale Prometheus for Optimal Performance of your system.
Thanos vs Prometheus- What’s the Difference?
Prometheus is an open-source system developed by SoundCloud, serving as a service monitoring system and time series database. It operates by collecting metrics from configured targets at specified intervals, evaluating rule expressions, presenting the results, and triggering alerts based on defined conditions.
On the other hand, Thanos is a collection of components that can be combined to create a highly available metric system with limitless storage capacity.
In simple terms, Thanos can be described as an advanced implementation of Prometheus that offers both high availability and long-term storage capabilities.
It seamlessly integrates with existing Prometheus deployments, utilizing the efficient storage format of Prometheus 2.0 to store historical metric data in object storage while maintaining rapid query response times.
Additionally, Thanos offers a global query view that spans all connected Prometheus installations and can merge data from high-availability Prometheus pairs on the fly.
Both Prometheus and Thanos fall under the category of “Monitoring” tools.
Prometheus provides the following notable features:
- A multi-dimensional data model that organizes time series based on metric name and a set of key-value dimensions.
- A flexible query language that leverages the dimensionality of the data model.
- Independence from distributed storage, allowing it to function effectively without relying on such infrastructure.
The key features of Thanos include:
- A global querying view that encompasses all interconnected Prometheus servers, enabling a unified perspective across multiple deployments.
- Deduplication and merging of metrics collected from Prometheus high availability pairs, ensuring accurate and consolidated data.
- Seamless integration with existing Prometheus setups, facilitating straightforward adoption without significant disruptions or migrations.
Why Choose Thanos: Scaling Prometheus for Optimal Performance
Prometheus is a favored monitoring solution, known for its real-time metric collection and querying abilities. It’s simplicity, integrability, and powerful visualizations make it ideal for small to medium-sized applications.
However, scaling Prometheus to meet the demands of a rapidly growing application poses a few challenges. You see Prometheus plays a pivotal role in the foundation of various monitoring solutions, and it’s only a matter of time before you encounter Prometheus federation.
Having a well-monitored application with flexible logging frameworks can yield significant advantages over an extended period of sustained growth.
But scaling Prometheus alone is tough due to heavy reliance on writing memory to disk. Configuring Prometheus for high performance at scale requires specialized knowledge. Querying petabytes of historical data becomes challenging, and reliance on disk operations for reading and writing data can limit performance.
Enter Thanos, a powerful Prometheus extension that addresses scaling challenges effortlessly. Thanos offers high availability and long-term storage capabilities. It seamlessly integrates with existing Prometheus deployments, extending functionalities for handling immense scalability.
Here's why you need Thanos
1. High Availability: Ensures your Prometheus setup remains highly available, enhancing reliability and resilience.
2. Limitless Storage: Provides virtually unlimited storage capacity for metric data using cost-efficient object storage.
3. Global Querying: Offers a unified query view across connected Prometheus installations, facilitating comprehensive infrastructure analysis.
4. Deduplication and Metric Merging: Effortlessly deduplicates and merges metrics from Prometheus high availability pairs, ensuring accurate and consolidated data.
5. Seamless Integration: Integrates seamlessly with your current Prometheus setup, leveraging Prometheus 2.0 storage format for optimized performance and query latencies.
In summary, as your application grows, scaling Prometheus efficiently becomes crucial. Thanos overcomes the limitations of traditional Prometheus deployments by offering high availability, limitless storage, global querying, and seamless integration.
Streamline Monitoring and Unleash AI Capabilities with Apica
apica.io seamlessly integrates with popular monitoring tools like Prometheus, Thanos, and VictoriaMetrics. Its built-in monitoring engine offers a scalable tier that leverages S3-compatible storage, enabling effortless scale-out with zero storage overhead.
Whether you use an existing time-series database or need to connect to external databases, apica.io provides enhanced capabilities for your time-series data.
Writing queries
Query language
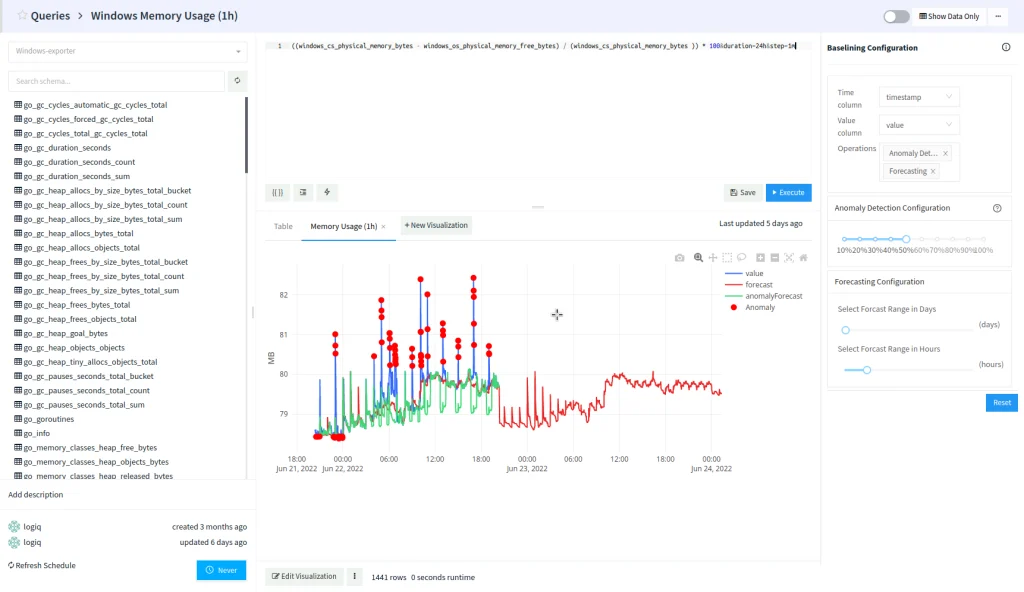
The query language utilized is referred to as PromQL expression, which includes additional parameters to be sent to the Prometheus Query API. A typical query starts with a “query=” prefix and can have optional URL parameters appended to it for the query API.
Let’s consider an example:
query=go_gc_duration_seconds&duration=15m&step=60
In the given query, we are seeking the “go_gc_duration_seconds” metric, sampled at 60-second intervals, for the duration of the last 15 minutes. The Prometheus Query API expects queries to provide start_time and end_time, but Apica simplifies this by using a duration syntax that is compatible with the Query API.
Apica automatically translates the duration values into appropriate start and end times before issuing the Query API call.
Using the duration syntax allows for the construction of dynamic time range queries without explicitly specifying start or end times.
Here are some examples:
					Instant query:
query=http_requests_total

Range query:
query=http_requests_total&start=2018-01-20T00:00:00.000Z&end=2018-01-25T00:00:00.000Z&step=60s

Range query until now:
query=http_requests_total&start=2018-01-20T00:00:00.000Z&step=60s
query=http_requests_total&start=2018-01-20T00:00:00.000Z&end=now&step=60s

Using duration:
query=http_requests_total&duration=1h5m10s20ms&step=60s
query=http_requests_total&start=2018-01-20T00:00:00.000Z&duration=1h&step=60s
query=http_requests_total&duration=1h&step=60s
query=http_requests_total&end=2018-01-20T00:00:00.000Z&duration=1h&step=60s
With apica.io, you can:
1. Connect with Ease: External time-series database connectors allow direct querying of your existing databases. For example, using the InfluxDB connector, you can effortlessly query data directly from InfluxDB and leverage apica.io’s AI/ML capabilities.
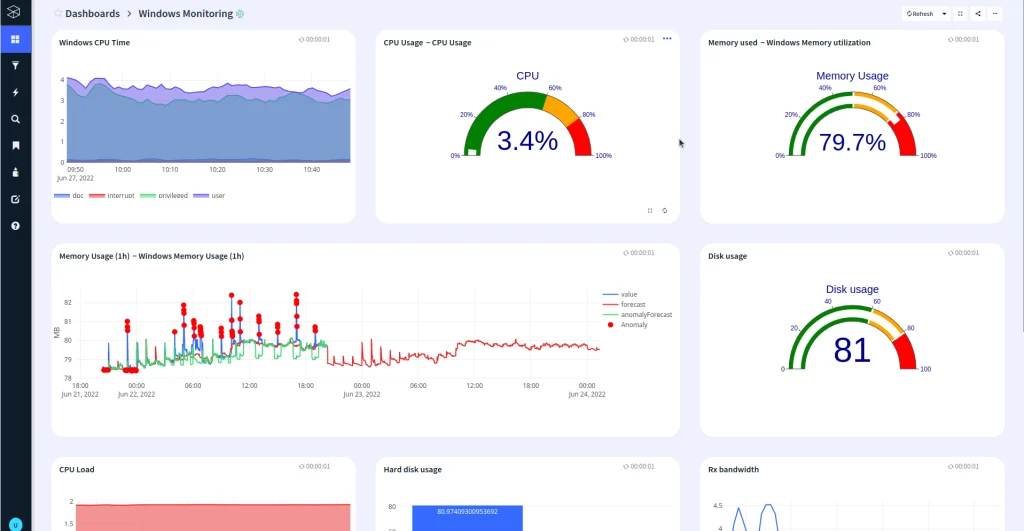
2. Empower Your Data: Once connected, Apica’s AI/ML capabilities enhance your time-series data. Benefit from features like anomaly detection, data baselining, forecasting, statistical models, visualization, and CRON-style reporting for your InfluxDB and other compatible databases.
3. Versatile Metrics Gathering: Apica offers multiple ways to gather and utilize application and infrastructure metrics, including Open Telemetry Metrics, Prometheus Remote Write Protocol, querying external Prometheus-compatible data sources, and integration with Amazon Managed Service for Prometheus (AMP).
4. Explore External Databases: Apica goes beyond time-series databases, allowing you to tap into the power of external databases such as Postgres, MySQL, Elastic, and more.
Don’t forget to check out Apica’s Prometheus Remote Write capabilities, which enable the seamless pushing of your metrics into Apica for comprehensive monitoring and analysis.
apica.io simplifies monitoring, provides AI-driven insights, and unlocks the full potential of your metrics data. Experience enhanced scalability, advanced analytics, and seamless integration with Apica today.