- Platform
Fleet
Fleet Management transforms the traditional, static method of telemetry into a dynamic, flexible system tailored to your unique operational needs. It offers a nuanced approach to observability data collection, emphasizing efficiency and adaptability.
FLEET management
 100% Pipeline control to maximize data value. Collect, optimize, store, transform, route, and replay your observability data – however, whenever and wherever you need it.
Capabilities
 Apica’s data lake (powered by InstaStore™), a patented single-tier storage platform that seamlessly integrates with any object storage. It fully indexes incoming data, providing uniform, on-demand, and real-time access to all information.
Capabilities

The most comprehensive and user-friendly platform in the industry. Gain real-time insights into every layer of your infrastructure with automatic anomaly detection and root cause analysis.
- Resources
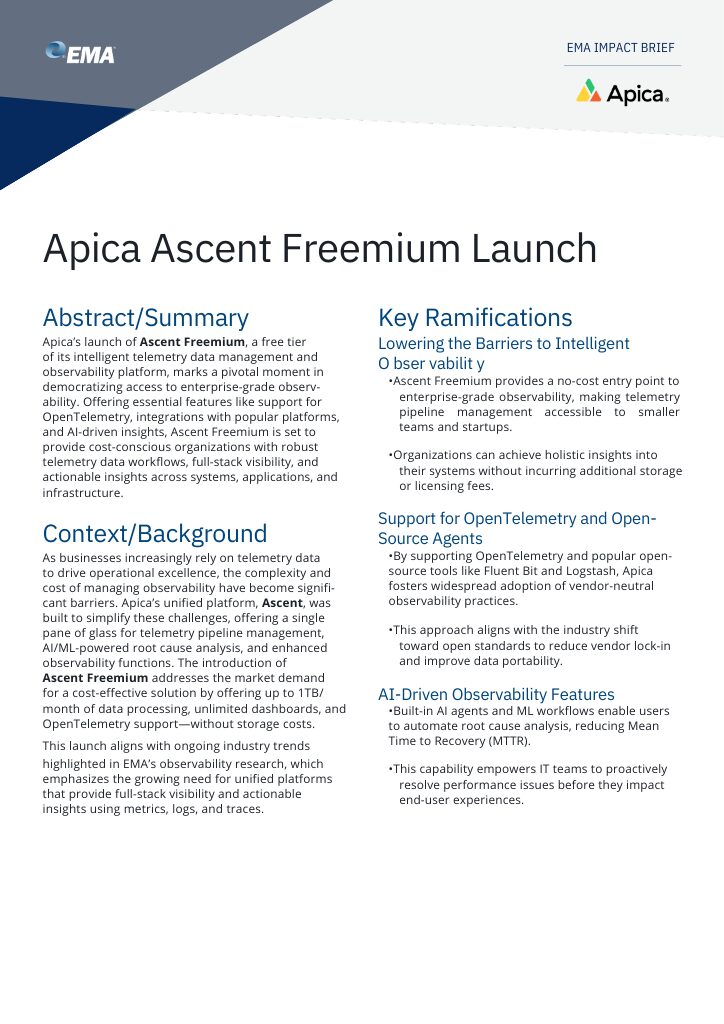
Apica Ascent Freemium Launch
Events & Webinars
Join us for live and virtual events featuring expert insights, customer stories, and partner connections. Don’t miss out on valuable learning opportunities!
Videos
Dive into valuable discussions and get to know our company through exclusive video content.Who is Apica?
Apica Ascent Freemium
Free Enterprise-Grade Telemetry Data Management and Observability is Here: Introducing Apica Freemium
DOCUMENTATION
Find easy-to-follow documentation with detailed guides and support to help you use our products effectively. - Solutions
by technology
- Company
About Us
Apica keeps enterprises operating. The Ascent platform delivers intelligent data management to quickly find and resolve complex digital performance issues before they negatively impact the bottom line.Security
In a world in constant motion where threat actors are everywhere it is important to always improve the security in all parts of your organization. We believe that is done by leveraging industry best practices and adopting the latest technology. We are proud to be both ISO27001 and SOC2 certified and thus your data is safe and secure with us.News
Stay updated with the latest news and press releases, featuring key developments and industry insights.

Apica Launches Ascent Freemium to Democratize Intelligent Telemetry Data Management and Observability.
Leadership
Meet our leadership team, dedicated to driving innovation and success. Discover the visionaries behind our company’s growth and strategic direction.Apica Partner Network
Join the Apica Partner Network and collaborate with industry leaders to deliver cutting-edge solutions. Together, we drive innovation, growth, and success for our clients.Careers
Build your future with us! Explore exciting career opportunities in a dynamic environment that values innovation, teamwork, and professional growth. - Login
Get Started Free
Get Enterprise-Grade Data Management Without the Enterprise Price Tag Manage Your Data Smarter – Start for FreeLoad Test Portal
Ensure seamless performance with robust load testing on Apica’s Test Portal powered by InstaStore™. Optimize reliability and scalability with real-time insights.
Monitoring Portal
Access the Monitoring Portal (powered by InstaStore™) to view live system performance data, monitor key metrics, and quickly identify any issues to maintain optimal reliability and uptime.


What is Apica?
Elevating Business Speed with Advanced Data Fabric
Apica helps your enterprise keep running smoothly. Our Ascent platform offers tools for real-time monitoring, digital experience monitoring, automatic problem-solving, and sophisticated data handling. This means it can quickly identify and fix complex issues in digital operations before they hurt profits.
Apica as a Solution
In the current business scene, enterprises rely on maintaining the performance of their diverse computing environments’ performance—whether they’re in the cloud, on-premises, or entirely on-site. Observability tools and other log management tools are the solution, in that they provide you with an all-encompassing view of your system and ensure users have a good experience.
Apica offers an advanced solution tailored for the current data-centric world by embracing core principles. These include:
- Scalable Architecture: Automatically expands to meet demand.
- Modular Infrastructure: Components operate independently for greater flexibility.
- Unlimited Computing Power: Provides the resources to handle any workload.
- Unlimited Storage Capacity: Ensures you never run out of space for your data.
- Cost Efficiency: Minimizes total cost of ownership without compromising performance.
- Instant Performance: Delivers real-time responsiveness for immediate insights and actions.

"An amazing platform for all of our observability needs"
"Active observability for IoT, awesome integration with Prometheus, fluent-bit"
"Gives complete visibility into our Google Cloud Run deployments"
"Perfect observability data fabric for AWS Serverless and API Gateway logs"
"All-in-one platform for AWS observability data management and more..."
"Solid and flexible alternative to Sumologic, without any vendor lock-in"
Apica platform offers
Observability and
Understanding
Get a detailed view of your entire digital environment so you can see what’s happening in real-time.
Finding and
Fixing Problems
Identify the cause of complex issues quickly and fix them before they affect your business.
Managing
Data
Organize and manage the massive amounts of data businesses deal with, aiming to prevent disruptions.

Challenges and Benefits
Keeping Your Business Running
With so many businesses relying on complex digital environments, like cloud services and on-premises data centers, it’s crucial to keep everything running without interruption. Apica aims to provide a single place where you can see all your technology systems’ information, helping reduce the chances of unexpected downtime or lost revenue, making us one of the best observability tools out there.
The Data Challenge
Businesses today deal with huge amounts of data from different sources, often exceeding 100GB per day. This includes everything from logs and metrics to data from APIs and databases. Managing and making sense of this data has been a challenge for IT teams, DevOps, and developers.
Simplifying Data Analysis
Apica’s goal is to make it easier to access and analyze IT data. By bringing together different types of data, such as logs, metrics, databases, and APIs, Apica allows you to:
- Combine log data from various sources.
- Monitor the performance of your systems in real-time.
- Connect to and integrate data from databases like Elastic, Mongo, Postgres, Druid, and MySQL.
Key Features
Scalability
You can store logs in any S3 compatible storage, helping to reduce storage costs and scale without limits.
Real-Time Monitoring
Monitor everything from servers and VMs to containers and Kubernetes clusters to keep your systems running smoothly.
Data Sources
Connect with over 20 different data sources for a complete picture of your IT infrastructure.
Monitoring Tools
Use Prometheus metrics for a detailed monitoring setup.
Application Performance
Get insights into how over 100 popular applications are performing to improve user experience.
Alerts
Receive alerts and notifications to stay informed about potential issues as they arise.
Apica is focused on making it easier for businesses to manage digital environments by providing tools to observe, analyze, and react to data and system performance.