As the holiday season approaches, the IT and Development teams for many ecommerce and online retail brands have already begun their application performance testing to gain answers to business-critical questions. What will happen when thousands upon thousands of users concurrently visit the web app to conduct their holiday gift shopping? At what point will the application present a performance bottleneck? How well will the application scale, and what will be the effect on the end-user as it does?
What is Throughput in Performance Testing?
Conducting comprehensive performance testing is the first step of the process to yield critical insights into the maximum performance and scalability of a new or existing application. A common approach is to select a prioritized use case, create a script, and then run a test where the load is slowly increased until a point where response times begin to fluctuate. This point is commonly known as the applications ‘maximum throughput’ for the selected use case.
Maximum throughput: the number of transactions per second an application can handle; the amount of transactions produced over time during a test.
Simply running tests isn’t enough
However, it’s not enough to simply run the tests. In order to properly assess the results, IT and Development teams must dig into the details for a true and accurate picture into the maximum performance and scalability of an application.
Apica recognizes the value of giving users the ability to view this information quickly and easily. With the latest release of Apica LoadTest, we have now added two new graphs for page and transaction throughput in relation to the number of virtual users in the test.
Leverage Page and Transaction
Throughput for App Insights
The differences in how these tests are set up and executed within Apica LoadTest are minimal, but how they are utilized, the results they produce, and the insights they expose, are significant. The ability to leverage both of these data points helps to effectively and efficiently test and analyze the performance of web applications.
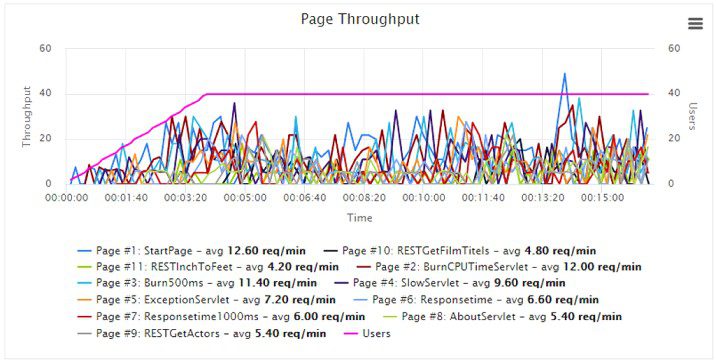
Page throughput is the number of pages requested per second compared to the number of concurrent virtual users in a given point of time during the ramp-up of the load.
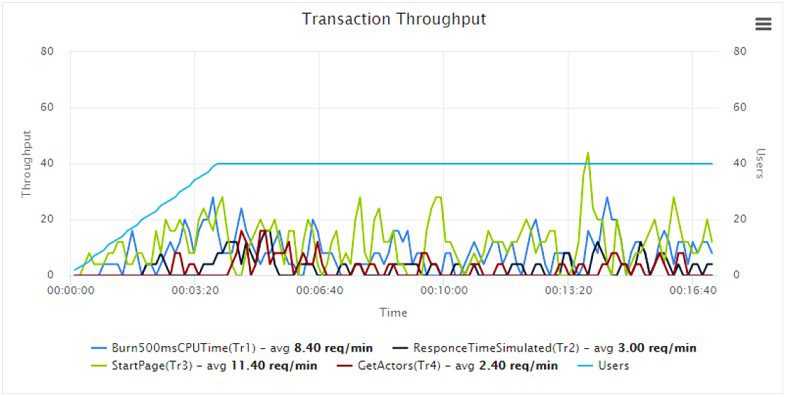
To drill down even further into an application’s performance, Apica has also added a new graph for transaction throughput. In Apica LoadTest, a transaction can be defined as one or more requests. Leveraging this chart allows users to drill down and measure the performance of a single HTTP/S request, for simplified bottleneck identification.
For now, the two new graphs can be accessed in the Apica LoadTest Live View. Soon Apica will be incorporating the graphs into the test result details, as well as in reports.
In short, throughput is a key concept for good performance testers to understand and is one of the top metrics used to measure how well an application is performing under duress and how that strain could impact performance. With an eye towards the holiday season, many application performance testers will be utilizing these data points for holistic insights into the business’ most important questions.
For more information on application performance, send a note to [email protected] or contact us for a free trial.


