Article
Reaching New Heights with Desktop Application Monitoring
There comes a time when a company must reach beyond its current capabilities and the low-hanging fruit, to reach more elusive customers. This is a

There comes a time when a company must reach beyond its current capabilities and the low-hanging fruit, to reach more elusive customers. This is a

Prometheus is a wildly deployed open source monitoring system for time series metrics. For observability use cases, it is important to bring together logs and
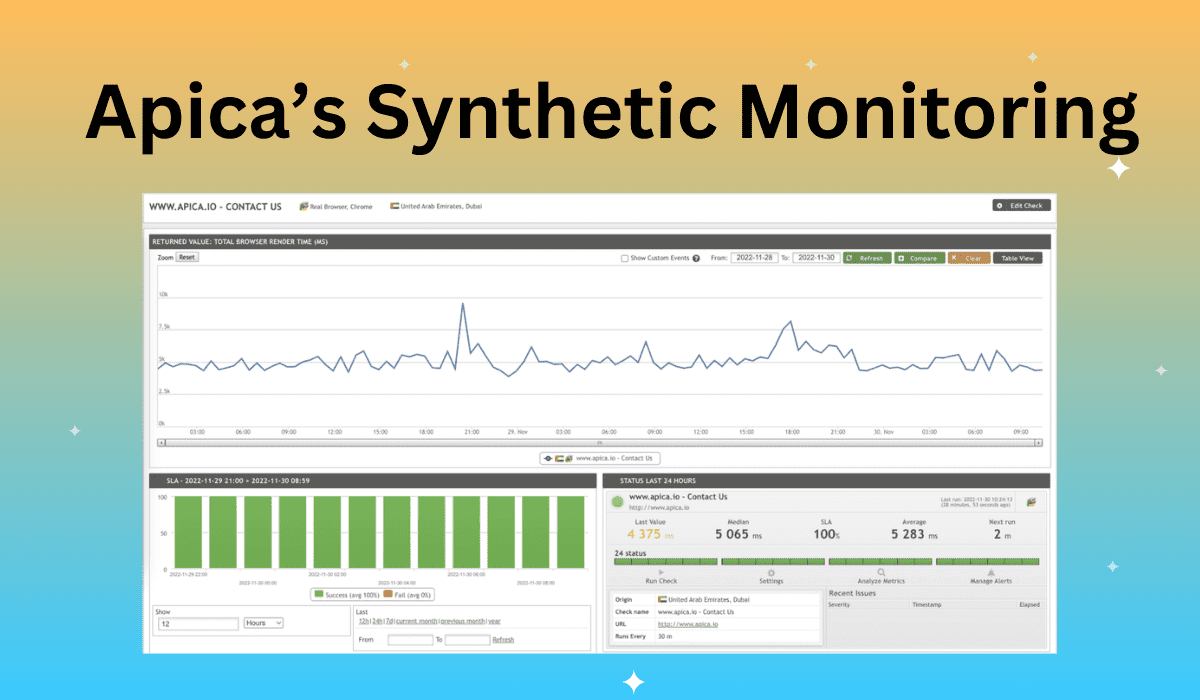
Monitoring application performance is more important than ever. With an ever-growing catalog of applications in need of support, and IT architecture increasing in complexity, ensuring

Metrics are the primary means of representing your system’s general health and any other valuable information for monitoring, alerting, and observability. Despite the Kubernetes ecosystem

For all the productivity gains created by DevOps, there’s a nasty side effect. Short release cycles, lots of infrastructure changes, and developer-driven changes to live

Guest post originally published by Greg O’Reilly on Visibility Platforms’ blog. In late 2021 we kick started a project with a customer who had shown

It’s likely that you already know how helpful logs can be in analyzing the inner workings of your IT environments. Beyond that, you may be

In January, the apica.io team shipped plenty of new features, enhanced existing ones, and squashed a few bugs to make your Active observability and data

Understanding your Kubernetes cluster’s internal dynamics is critical for system and application performance. Reading, analyzing, and evaluating your logs allow you to fine-tune your applications