


How do you monitor applications in a continuously growing distributed system when Cloud computing, microservices, and open source tools continue to evolve in complexity?
Spoiler alert: The answer is distributed tracing.
But what is distributed tracing, how does it work, and why does everybody rely on it to keep up with the swiftly moving application development wave?
This blog is your essential guide to all things distributed tracing – from the what(s), the how(s), and the why(s). Learn how it works, best practices, and what are the best distributed tracing platforms.
What is Distributed Tracing?
Distributed tracing is a method used to track the flow of a request as it travels through multiple services in a distributed system. It’s like a map that shows each step the request takes, how long it stays there, and where things might be slowing down or breaking.
In other words, distributed tracing enables developers to monitor and understand the flow of data requests across multiple microservices within a distributed system.

Distributed tracing is a core observability technique for modern, microservices-based architectures. It enables the end-to-end tracking of individual requests (or transactions) as they propagate across services, containers, APIs, queues, databases, and external systems. Each point the request touches is recorded as a “span,” and all these spans are tied together under a single trace ID—giving engineers and AI systems a full narrative of the request’s journey.
Key components include:
Trace ID: A unique identifier for the entire request across all services.
Spans: Time-stamped segments of work done in a service, with parent-child relationships showing causality.
Context propagation: Carries trace context (headers or metadata) through protocols like HTTP, gRPC, or messaging queues.
This allows teams to:
Pinpoint bottlenecks (e.g., slow services or failing dependencies),
Analyze latency patterns across the system,
Correlate logs, metrics, and traces for faster root cause analysis,
And improve performance and reliability in production.
Distributed tracing is a foundational element in tools like OpenTelemetry, Jaeger, Zipkin, and commercial platforms like Apica Observe, Datadog, or New Relic.
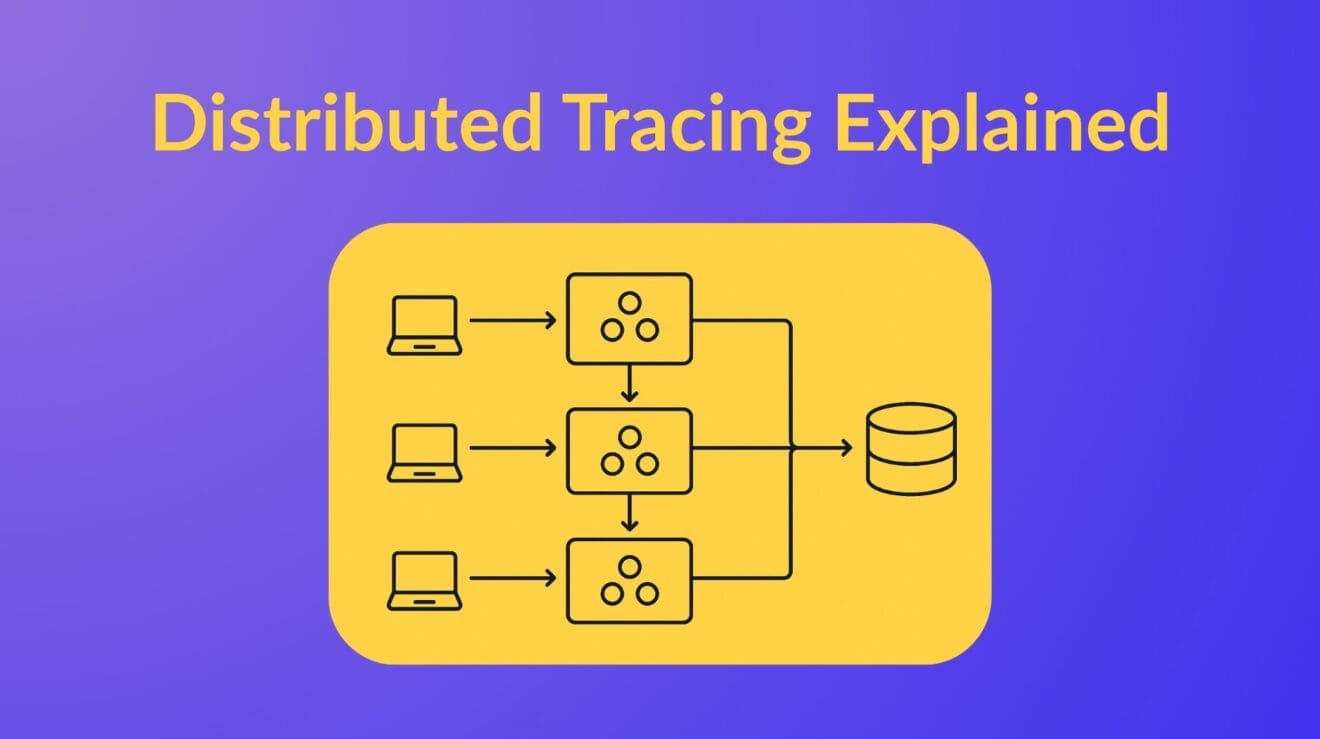
Here’s a good visual representation of distributed tracing.
Types of Distributed Tracing
Understanding the different types of tracing can help select the appropriate method for specific debugging and performance analysis needs.
Here are three different types of distributed tracing:
Code Tracing
Code tracing involves analyzing the execution flow of an application’s source code during runtime. This method helps developers understand the sequence of operations, identify logical errors, and verify that the application behaves as expected. Developers can inspect variables, control structures, and function calls by stepping through the code to pinpoint issues.
Program Tracing
Program tracing monitors an application’s execution at the instruction level. It captures detailed information about the program’s state, including memory addresses, register values, and system calls. This low-level tracing is essential for debugging complex issues such as memory leaks, race conditions, and performance bottlenecks.
End-to-End Tracing
End-to-end tracing, often synonymous with distributed tracing, tracks a request’s complete journey across multiple services in a distributed system. It assigns a unique identifier to each request, allowing for the correlation of logs and metrics across services. This comprehensive view helps identify the system’s latency issues, service dependencies, and failure points. It is helpful in microservices, where a single request traverses multiple services before completion.
How does distributed tracing work?
Distributed tracing enables tracking individual requests as they propagate through various distributed system components, providing visibility into the system’s behavior and performance.
The following are the core components and workflow:
- Trace and Span Identification
a. Every incoming request is assigned a unique Trace ID that serves as a global identifier for the request’s lifecycle.
b. As the request is processed, each operation within the system is represented as a Span, which includes metadata such as operation name, start and end timestamps, and contextual information. - Instrumentation
a. Applications are instrumented using libraries provided by frameworks like OpenTelemetry.
b. These libraries capture span data for operations and automatically handle context propagation. - Context Propagation
a. Context propagation mechanisms maintain the relationship between spans across service boundaries.
b. This involves transmitting trace context (e.g., Trace ID and Span ID) via headers in HTTP or messaging protocols, ensuring that each service can associate its spans with the overall trace. - Data Collection and Export
a. Collected spans are exported to a backend system for storage and analysis.
b. OpenTelemetry allows exporters to send trace data to various backends, including Jaeger, Zipkin, and others. - Visualization and Analysis
Backend systems like Jaeger aggregate and visualize trace data, allowing developers to analyze request flows, identify bottlenecks, and troubleshoot issues effectively.

Let’s understand it better with the help of a real-world example. Consider an e-commerce application where a user’s purchase request involves multiple microservices:
- Service A: Handles user authentication.
- Service B: Processes payment.
- Service C: Manages inventory.
- Service D: Generates order confirmation.
As the request flows through these services:
- A unique Trace ID is assigned at the entry point.
- Each service creates a Span detailing its operation.
- Context is propagated to maintain the trace’s continuity.
- All spans are collected and sent to a backend like Jaeger.
- Developers can then visualize the complete request path and analyze performance metrics.
This systematic approach provides end-to-end visibility into complex, distributed systems, facilitating efficient monitoring and debugging.
Difference between Distributed Tracing, Traditional Tracing and Logging
Distributed tracing differs from the traditional form of tracing and logging in many ways.
Below is a comparison table showing how distributed tracing is different from logging and traditional tracing in many aspects:
| Aspect | Distributed Tracing | Traditional Tracing | Logging |
|---|---|---|---|
| Scope | Tracks requests across multiple services in distributed systems. | Monitors execution within a single application or process. | Captures discrete events within individual components or applications. |
| Purpose | Provides end-to-end visibility of requests to identify performance bottlenecks and errors. | Helps in understanding the flow and performance within a single application. | Captures events, errors, and informational messages for debugging and monitoring. |
| Data Structure | Encapsulates spans and traces representing the flow of requests across services. | Involves adding tracing code within the application, typically manually. | Implemented by inserting log statements in code, manually or through logging frameworks. |
| Instrumentation | Uses standardized protocols (like OpenTelemetry) to instrument across services. | Primarily manual instrumentation within monolithic applications. | Low-code or no-code insertion; supports search and filtering capabilities. |
| Use Cases | Microservices latency analysis, root cause identification, SLAs tracking. | Profiling and debugging in traditional or legacy environments. | Error tracking, usage monitoring, audit logging, and event capture. |
| Performance Impact | Can introduce overhead due to real-time tracing across services. | Lightweight since it targets single process execution. | Varies with volume; excessive logging may degrade performance. |
| Correlation | Correlates events across services via trace IDs, enabling full-stack insights. | Limited correlation confined within single app context. | Requires consistent log formatting and external tools for service-wide correlation. |
What are the Distributed Tracing Standards?
Distributed tracing standards establish consistent methods for instrumenting, collecting, and exporting trace data across diverse systems and programming languages. These standards facilitate interoperability, enabling developers to monitor and analyze distributed applications without being confined to specific vendors.
These are the key distributed tracing standards:
OpenTracing
OpenTracing, an initiative by the Cloud Native Computing Foundation (CNCF), provided a vendor-neutral API for distributed tracing. It defined standard interfaces for span creation, context propagation, and trace management, allowing developers to instrument applications consistently across various platforms. OpenTracing supported multiple languages, including Go, Java, Python, and C++.
OpenCensus
Developed by Google, OpenCensus offered a set of libraries for collecting application metrics and distributed traces. It enabled automatic instrumentation and provided exporters to various backends like Prometheus, Stackdriver, and Zipkin. OpenCensus emphasized a single, cohesive library per language, simplifying the instrumentation process.
OpenTelemetry
OpenTelemetry is a unified project that merges OpenTracing and OpenCensus, aiming to provide a comprehensive observability framework. It is an open-source project that provides a set of APIs and SDKs for instrumenting applications.
A few key points about OpenTelemetry:
- OpenTelemetry is designed to be vendor-neutral
- It offers APIs and SDKs for multiple languages
- It has an active community of contributors
OpenTelemetry supports multiple languages and is designed to integrate seamlessly with various backends, promoting vendor-agnostic observability.
The Benefits of Distributed Tracing
Distributed tracing is an imperative observability technique. It provides detailed insights into how requests flow through complex, distributed systems. Thus, by gathering and analyzing traces, organizations can achieve several key benefits:
- Accelerated Troubleshooting
Distributed tracing enables teams to pinpoint the exact location and cause of performance issues or errors within a system. By visualizing the path of a request across services, engineers can quickly identify bottlenecks or failures, reducing the time to detect (MTTD) and resolve (MTTR) incidents.
- Enhanced Observability
Distributed tracing provides a comprehensive view of service interactions, allowing teams to understand dependencies and monitor system health effectively.
- Improved Collaboration and Accountability
Distributed tracing clarifies which service is responsible for a particular issue in environments where multiple teams own different services. This clarity fosters better team collaboration and accountability, streamlining the debugging and resolution process.
- SLA Compliance Monitoring
Distributed tracing tools aggregate performance data, enabling organizations to monitor Service Level Agreements (SLAs) adherence. By tracking metrics like response times and error rates, teams can ensure they meet contractual obligations and maintain customer satisfaction.
- Support for Deployment Strategies
During canary or blue-green deployments, distributed tracing helps monitor the performance of new code changes in real time. This immediate feedback allows teams to detect issues early and make informed decisions about rolling out or rolling back changes.
- Reduced Reliance on Logs
While logs provide valuable information, they can be overwhelming and lack context. Distributed tracing offers a structured, visual representation of request flows, making it easier to understand system behavior without sifting through extensive log files.
What are the Challenges?

As with any technical practice, distributed tracing comes with its limitations. Below are some significant difficulties associated with distributed tracing:
1. Manual Instrumentation
Integrating tracing requires adding specific code to each service to emit trace data. This process can be time-consuming and may introduce inconsistencies, especially when different teams handle various services.
2. High Data Volume
Each request generates trace data, leading to substantial storage and processing demands. Managing this volume efficiently is crucial to prevent system strain.
3. Performance Overhead
Collecting and exporting trace data can impact application performance. If not optimized, tracking can slow down services, particularly in resource-constrained environments.
4. Sampling Complexity
Due to resource limitations, it isn’t feasible to capture every request. Implementing effective sampling strategies is essential to maintaining visibility without overwhelming storage.
Addressing these challenges involves careful planning, selecting appropriate tools, and ongoing optimization to ensure that distributed tracing provides meaningful insights without adversely affecting system performance.
How to Choose the Best Platform for Your Distributed Tracing Needs
Choosing a distributed tracing platform can feel overwhelming, especially with so many tools (open-source and commercial) available.
Here’s how to cut through the noise and find what works for your setup:
Step 1. Know Your Environment
Is your system small and service-light? Tools like Jaeger or Zipkin could be enough. Running at scale? You’ll likely need something more advanced, like Tempo or a commercial solution.
Step 2. Check Compatibility
Make sure the tool works well with your stack—languages, frameworks, and cloud setup. OpenTelemetry is a good bet for flexibility here.
Step 3. Storage Matters
Not all tools handle storage the same way. Dig into those details early if you need to keep trace data for a while or route it to different backends.
Step 4. UI and UX Count
A clean interface saves time during incidents. Some open-source tools are catching up, but commercial platforms still win on polish and ease of use. (Apica has a stellar UX with insightful dashboards and straightforward navigation; explore here.)
Step 5. Support and Docs
If you’re going open source, look for an active community and solid docs. If you’re buying, make sure the support justifies the price.
Step 6. Think Budget + Maintenance
Open-source may look free, but setup and upkeep take time. Commercial tools cost more upfront but may reduce ongoing engineering efforts.
Step 7. Run a Trial
Test it in your environment. Let your team play with it. See if it helps or adds more work.
Each step helps you move from “just exploring” to choosing a tool that works—for your architecture, team, and workflow.
Apica Ascent implements protocol endpoints to ingest directly from both the Jaeger agent and the OTel Collector while streaming and indexing the data to any object store. This makes the Apica Ascent implementation infinitely scalable for large volumes of trace data.

The Best Distributed Tracing Platforms
Distributed tracing platforms help you track how requests move through different parts of your system. It’s like a GPS for your software; you can see where a request goes, how long it takes at each step, and where it might slow down.
These platforms are especially useful for modern apps that are built with microservices, where one task might pass through multiple services before it’s complete. If something breaks or becomes slow, distributed tracing helps you quickly figure out where and why.
Top Distributed Tracing Tools (2025)
Jaeger – Free and open source. Great for teams already using OpenTelemetry.
Zipkin – Lightweight and easy to integrate. A solid choice for basic tracing needs.
Grafana Tempo – Scalable, cost-effective, and works well with Grafana dashboards.
AWS X-Ray – Perfect for teams running apps in the AWS cloud.
Datadog APM – Full-featured platform with great UI and deep integrations.
New Relic – Powerful visualizations and automatic instrumentation.
Lightstep – Designed for deep tracing and root cause analysis in real time.
Apica Observe – Combines tracing with metrics, logs, and synthetic monitoring to give end-to-end visibility.
What Makes a Great Distributed Tracing Platform?
A robust tracing platform should:
Support OpenTelemetry: Ensures vendor-neutral collection of spans, metrics, and logs.
Correlate Traces, Metrics, and Logs: Enables faster root cause analysis by seeing everything in context.
Scalability: Handles high cardinality and data volume from large, dynamic environments.
Storage Efficiency: Offers smart sampling, compression, or decoupled object storage (e.g., Apica InstaStore).
Low Latency Querying: Rapid search and trace navigation with minimal lag.
AI/ML Insights: Identifies anomalies, patterns, and outliers proactively.
Service Dependency Maps: Visualizes how microservices connect and interact.
Pro Tip: Combine Tracing with Other Telemetry
The real power of observability comes when traces, logs, metrics, and events are unified. Choosing a platform like Apica, that integrates all telemetry into a single pane of glass will help you stay ahead in your distributed tracing needs.
Distributed Tracing Platforms Comparison (2025)
| Platform | OpenTelemetry Support | Correlation | UI/UX | Storage Model | Unique Strength |
|---|---|---|---|---|---|
| Jaeger | ✅ | ❌ | Basic | Local/Disk | Fully OSS & CNCF |
| Zipkin | ✅ | ❌ | Minimal | In-memory/File | Lightweight |
| Grafana Tempo | ✅ | ✅ | Good | Object Storage | No indexing cost |
| AWS X-Ray | Partial | ✅ | Good | Managed | AWS native |
| Datadog APM | ✅ | ✅ | Excellent | Proprietary | Deep integrations |
| New Relic | ✅ | ✅ | Great | Proprietary | Auto-instrumentation |
| Lightstep | ✅ | ✅ | Excellent | Streamed | Real-time RCA |
| Apica Observe | ✅ | ✅ | Excellent | InstaStore (S3-compatible) | End-to-end telemetry + synthetic checks |
TL;DR
- Why Tracing Matters: Distributed tracing tracks requests across microservices like a GPS for your app.
Top Platforms: Tools like Jaeger, Datadog, and Apica Observe help pinpoint issues fast.
Key Features: Look for OpenTelemetry support, trace correlation, and AI-powered insights.
Platform Comparison: Apica, Lightstep, and Tempo offer unique strengths for scale and performance.
2025 Trends: Unified observability and storage-efficient tracing are now must-haves.
Pro Tip: Combine tracing with logs and metrics for faster, smarter troubleshooting.
