Telemetry Pipeline Insights & Observability Best Practices

How to Configure Kubernetes RBAC, Network Policies, and Runtime Privileges
Kubernetes is an open-source cluster management system with many applications in the world of business and commerce. Kubernetes was first developed by Google in 2014 and was heavily influenced by Google’s Borg cluster management system. Currently, it is developed and maintained by the Cloud Native Computing Foundation. The main benefit that Kubernetes lends to businesses … Read more

Monitoring your ECS Fargate logs with AWS FireLens and Apica
Amazon Web Services (AWS) Fargate is a serverless compute engine for containers that works on Amazon ECS and EKS. AWS FireLens is a log routing agent built for ECS containers and enables administrators to use task definition attributes to route logs to external log aggregators. AWS FireLens unifies data collection across the ECS cluster, and … Read more
RabbitMQ monitoring made easy with Apica
RabbitMQ is one of the most popular hybrid message brokers available today. It brokers inter-service communication between distributed microservices that make up an application. RabbitMQ consists of the RabbitMQ exchange and message queues and sits in between services that communicate with each other. When a producer forwards a message to RabbitMQ, the RabbitMQ exchange receives … Read more

Get More Value from Data Through Log Visualization
Why do you keep logs? Regardless of the type of logs we’re talking about, you keep them because you expect them to provide some value for the organization. Maybe the logs will help you improve profitability; perhaps they will help you recover from downtime or perhaps they are expected to alert you to a security incident in … Read more
Kubernetes monitoring and observability in 4 simple steps
Kubernetes is a go-to solution for most cloud operators when it comes to container orchestration in distributed environments. Kubernetes performs phenomenally well when automating web server provisioning based on traffic, scaling and degrading servers based on demand, and load balancing for routing traffic. But with the level of distribution Kubernetes environments are subjected to these … Read more

How to detect runtime threats in Kubernetes
Kubernetes is one of the leaders in the container orchestration market. A recent survey by Cloud Native Computing Foundation (CNCF) suggests that 84% of companies are running Kubernetes containers in production. However, organizations running Kubernetes have also reported severe security threats in their respective container environments; with each threat linked to the container’s lifecycle phase. … Read more
Deploying Apica on MicroK8s using a Helm Chart
In a previous article, we showed you how to deploy your favourite application on MicroK8s using a Helm chart. In that article, we used the Apica Helm chart as the example application we were deploying on MicroK8s. This article will take an in-depth look at how we deploy Apica for our customers on MicroK8s, mapped … Read more

How to secure your Kubernetes control plane and node components
Kubernetes is an open-source container orchestration platform designed to run distributed services and applications at scale. A K8s or Kubernetes cluster contains several components that are a part of either the Kubernetes control plane or Kubernetes nodes. Over the years, Kubernetes has emerged as the hot topic in the DevOps space and is among the … Read more

Optimize product engineering efforts with unified log management
Engineering and developing a world-class product in a distributed environment is challenging. When said engineering needs to be carried out by a team that is distributed geographically and spans organizational boundaries, you’d have to stay on top of a lot of things. You’d have to ensure proper visibility of development data and project statuses, invest … Read more
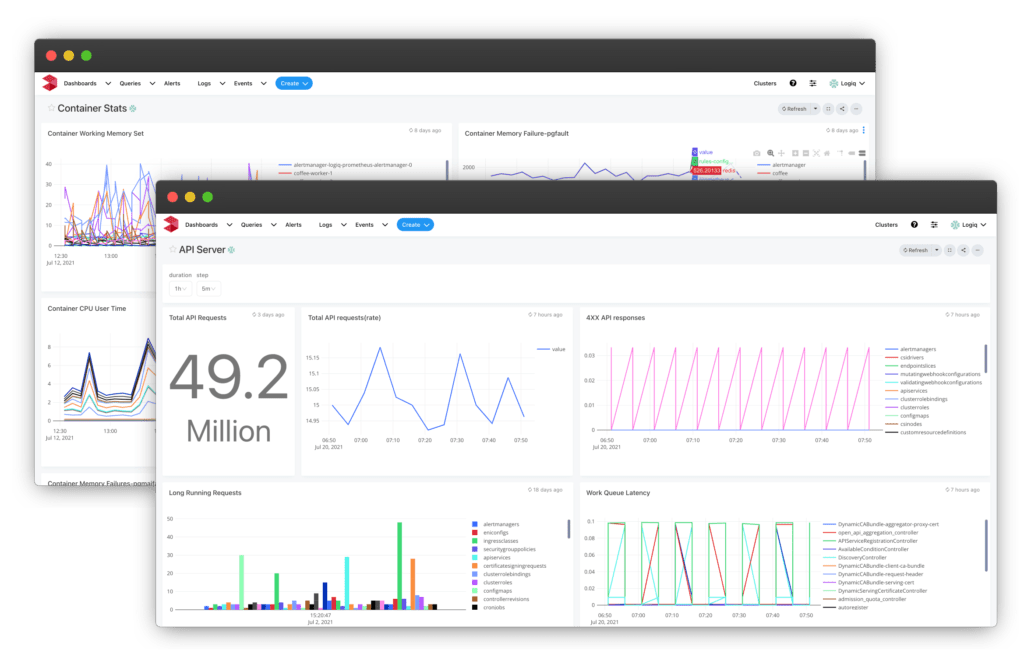
Announcing ApicaHub: Ready-to-use monitoring and observability dashboards
ApicaHub is officially live! ApicaHub is a collection of pre-built, ready-to-use dashboards for monitoring and observing important metrics for popular infrastructure and cloud services. Using these dashboards, you can go from installing Apica to instantly deriving valuable and actionable insights from logs and metrics from your infrastructure services. ApicaHub dashboards are preconfigured to extract, plot, … Read more

Ensure SOC compliance by managing logs with Apica
If your company uses or offers services or products over the cloud, the onus is always on the provider to ensure that information shared by customers and users is safely handled and stored. With data privacy and security being the top priority of anyone that uses cloud applications or services, you would often have to … Read more

Shift from API Monitoring to API Observability with Apica
APIs – by now, we’re all familiar with the term. Every service or software we use or build today either uses or is an API. If APIs are a central pillar in your building and delivery of software and services, you’ll know that the success of your software or services depends on the integrity, availability, … Read more