
With a slew of options at hand, choosing the best observability tools is challenging. Not to mention the strenuous task of researching the web, reading reviews, and scheduling demos to find the best option.
That said, I believe the better question should be “How to choose the right observability tools for you?” This article aims to answer that along with a detailed overview of what features to look for, what are the challenges, and how to choose a compatible observability tool for your enterprise.
The 15 best observability tools compared
| Tool | Pricing (starting list price) | Deployment | Best for |
|---|---|---|---|
| Apica Ascent | Free plan up to 1 TB/month through the pipeline, unlimited users; usage-based or annual contract beyond that | SaaS or on-premises | Cutting ingest cost with a pipeline in front of the tools you already run |
| Chronosphere | Custom pricing (now part of Palo Alto Networks) | SaaS | Very large cloud-native metric volumes |
| Coralogix | Logs from $0.50/GB (monitoring) to $1.15/GB (frequent search); archive stored in your own bucket | SaaS, data in your cloud account | Teams that want to own their archive |
| Datadog | Infrastructure from $15/host/month, APM $31/host/month, logs $0.10/GB plus indexing | SaaS only | Broadest all-in-one SaaS, if the budget can take it |
| Dynatrace | Full-Stack from $0.01 per memory-GiB-hour (about $58/month per 8 GiB host), logs $0.20/GiB | SaaS or self-managed | Large enterprises that want automatic root cause |
| Elastic Observability | Serverless from $0.09/GB ingested plus $0.019/GB/month retained | Serverless, hosted or self-managed | Log-heavy teams with Elasticsearch skills |
| Grafana Cloud | Free tier (10K metric series, 50 GB logs); Pro $19/month plus $6.50 per 1K series and $0.40/GB log writes | SaaS or self-hosted open source | Prometheus and open-source shops |
| Honeycomb | Free up to 20M events/month; Pro $3.00 per million events | SaaS | High-cardinality debugging of distributed systems |
| IBM Instana | From $20/host/month (Essentials) or $75/host/month (Standard), 10-host minimum | SaaS or self-hosted | IBM environments that need unsampled traces |
| New Relic | 100 GB/month free, then $0.35/GB, plus per-user fees ($349/full user on Pro) | SaaS | Small teams that can live inside the free tier |
| Observe | Not published (now part of Snowflake) | SaaS on Snowflake | Companies already running on Snowflake |
| OpenObserve | Flat $0.50/GB ingested (cloud) | Cloud or self-hosted open source | The lowest-cost open-source option |
| SigNoz | Cloud from $49/month, logs $0.30/GB | Cloud or self-hosted (free) | OpenTelemetry-first teams that want to self-host |
| Splunk Observability Cloud | $15, $60 or $75/host/month by edition; logs licensed separately | SaaS | Organizations already on Splunk |
| Sumo Logic | $0 ingest; you pay per TB scanned (about $3.14/TB mid-range) | SaaS only | Log and SIEM teams that ingest a lot and query a little |
List prices as of September 2026, taken from vendor pricing pages where they’re published. Negotiated prices are usually lower, and most vendors bill some items separately.
The tools in detail
Apica Ascent
Apica Ascent is our own platform, so read this one with that in mind. It puts a telemetry pipeline (Flow) in front of whatever tools you already run, filters and routes data before you pay to ingest it, and keeps the full record in Lake at object-storage prices. You can keep Datadog or Splunk and simply send them less. The free plan covers up to 1 TB a month through the pipeline with unlimited users. Paid plans are usage-based or on annual contract, and it runs as SaaS or on-premises. It’s the right fit when the problem is the size of the bill more than a missing feature.
Chronosphere
Chronosphere was founded by the engineers behind Uber’s metrics platform, and it shows: it’s built for huge volumes of Prometheus-style metrics and high cardinality. It also ships its own telemetry pipeline, which you can buy on its own. Palo Alto Networks has completed its acquisition of Chronosphere and plans to connect it to its Cortex AgentiX platform for automated remediation. Pricing isn’t published, so expect an enterprise sales process. It’s worth a look if metrics scale is your main problem and you’re comfortable with a security vendor owning your observability stack.
Coralogix
Coralogix processes logs in the stream before indexing them, then lets you choose how much you pay per data type: $1.15/GB for data you search often, $0.50/GB for data you only alert on, and cheap archive storage in your own S3 or GCS bucket. That last part matters. Your data stays in your cloud account in open formats, which makes leaving easier later. Traces and metrics are priced separately, and lower. It suits log-heavy teams who want fine control over cost per data stream and don’t mind the up-front work of sorting data into tiers.
Datadog
Datadog is the default for a reason. It covers infrastructure, APM, logs, RUM, synthetics and security in one polished SaaS product, with integrations for almost everything. The catch is the bill. Every product is metered separately, starting at $15 per host per month for infrastructure and $31 for APM, and logs are charged once to ingest and again to index. Custom metrics and high-cardinality tags add up fast. Datadog makes sense when you want one vendor and your data volumes are predictable. Teams whose volumes are growing fast often put a pipeline in front of it to control what gets sent.
Dynatrace
Dynatrace leans hard on automation. Its OneAgent discovers your stack and maps dependencies, and its Davis AI does topology-aware root cause analysis, so you’re not left correlating alerts by hand. Pricing is a detailed rate card: Full-Stack Monitoring is $0.01 per memory-GiB-hour (about $58 a month for an 8 GiB host), logs are $0.20 per GiB, and pods, sessions and queries each have their own meter. Bigger hosts cost more, since price scales with memory. It fits large enterprises with complex, mixed estates that want answers more than raw data, and can commit to an annual subscription.
Elastic Observability
Elastic Observability is built on Elasticsearch, so search is its home turf. Logs, metrics, traces and synthetics land in one place, and you can query them with ES|QL, KQL or plain Lucene. You can run it serverless, hosted on Elastic Cloud or self-managed on your own hardware. Serverless pricing starts at $0.09/GB ingested plus $0.019/GB a month retained, and metrics are cheaper still. One detail to watch: Elastic bills on the enriched size of your data, which is larger than the raw logs you send. It’s great value for log-heavy teams that already know how to run Elasticsearch.
Grafana Cloud
Grafana Cloud is the managed version of the open-source stack many teams already run: Grafana for dashboards, Prometheus-compatible metrics, Loki for logs and Tempo for traces. The free tier is generous, with 10,000 metric series and 50 GB each of logs and traces a month. Pro starts with a $19 monthly platform fee, then $6.50 per 1,000 metric series and $0.40/GB to write logs, plus small charges to process and retain them. Because it’s open source underneath, you can self-host the same stack if the pricing stops working for you. Metric series can climb fast, so keep an eye on cardinality.
Honeycomb
Honeycomb is built for debugging. It stores wide, high-cardinality events, so you can slice production traffic by any field (user ID, build, feature flag) and use BubbleUp to see what’s different about the slow requests. It’s OpenTelemetry-native. Pricing is per event, with no host or per-GB fees: the free plan covers 20 million events a month, and since July 2026 Pro costs $3.00 per million events, with Time Series Metrics and its AI features now included. Existing Pro customers can stay on legacy pricing until the end of 2026. It suits teams running complex distributed systems who ask new questions every incident.
IBM Instana
IBM Instana licenses by host and bundles nearly everything into that price, so the bill is easy to predict. Essentials starts at $20 per host per month for infrastructure monitoring, and Standard at $75 per host per month for full-stack APM, tracing and log management, with a 10-host minimum and unlimited users. It captures every trace by default and reports metrics at one-second granularity. You can run it as SaaS or self-hosted with the same features. It’s a natural choice for IBM-heavy environments and for teams that need complete traces for compliance.
New Relic
New Relic dropped per-host pricing in 2020: now you pay for data and for users, with unlimited hosts. Every account gets 100 GB of free ingest a month and one full platform user, which makes it one of the easiest tools to try properly. Beyond that, data costs $0.35/GB at New Relic’s current list price. The expensive part is people. Anyone who debugs in APM needs a full platform seat, and on the Pro plan those run $349 per user per month on annual billing. It’s a strong pick for small teams, and worth modeling carefully once your on-call rotation grows.
Observe
Observe was built on Snowflake from day one, keeping all your telemetry in one place, and customers pay for the data they access rather than everything they store. Its AI SRE assistant lets engineers investigate incidents in plain language. Snowflake closed its acquisition of Observe in February 2026, so expect deeper ties to the rest of the Snowflake platform. Pricing isn’t published and runs through sales. It makes the most sense for companies already on Snowflake, where keeping telemetry next to business data is a real advantage. If you’re not a Snowflake shop, weigh how much of the value depends on it.
OpenObserve
OpenObserve is an open-source platform for logs, metrics and traces that stores data as columnar Parquet files on object storage, which keeps long-term retention cheap. Its cloud service charges a flat $0.50/GB of ingested data plus a small fee for data your queries scan, with retention included and no host, seat or per-session fees. You can also self-host the open-source version and pay only for your own infrastructure. It’s younger than most tools on this list, so expect fewer integrations and enterprise extras. It fits cost-conscious teams that are comfortable running open source.
SigNoz
SigNoz is OpenTelemetry-native from the ground up and runs on ClickHouse, with logs, metrics and traces in one interface. You can query with a visual builder, ClickHouse SQL or PromQL. The self-hosted Community Edition is free with no feature limits, which makes it popular with teams that need to keep data in-house. SigNoz Cloud starts at $49 a month, with logs at $0.30/GB, no query fees and no per-user charges. It’s a good match for teams standardizing on OpenTelemetry who want an open-source option they can move between cloud and self-hosted.
Splunk Observability Cloud
Splunk Observability Cloud is Splunk’s SaaS product for infrastructure, APM, real user monitoring and synthetics, separate from the Splunk platform most people know for logs and security. It’s built on OpenTelemetry and priced per host: $15 a month for Infrastructure, $60 for App & Infra and $75 for End-to-End, billed annually. Most telemetry is included in the host price, though custom metrics above your allowance cost extra. Logs are the catch, since they’re licensed separately on the Splunk platform. If your company already runs Splunk, this is the easiest way to add modern APM in the same ecosystem.
Sumo Logic
Sumo Logic flips the usual model with Flex Pricing: ingest is free, and you pay for the data your queries scan, about $3.14 per TB for a mid-range usage profile. Users are unlimited. The same platform runs Cloud SIEM and SOAR, so security and operations teams work from one copy of the data. The trade-off is predictability. Every dashboard refresh and alert evaluation scans data, so a team that queries heavily can pay far more than the $0 ingest headline suggests. It’s a strong fit for teams that collect a lot for compliance or security and search it only occasionally.
What are Observability tools?
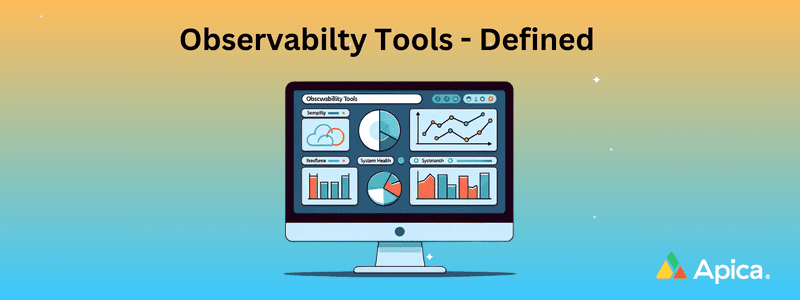
Observability tools serve as centralized platforms that not just monitor but analyze your system’s key data aspects including logs, metrics, traces, events, etc. Simply put, they offer an all-encompassing monitoring solution by collecting data from various sources.
The Observability tools are particularly adept at dealing with “unknown unknowns” – issues or problems within a system that are not anticipated or predictable based on existing knowledge or data. Unlike standard monitoring solutions that alert you to known issues, observability tools dive deeper.
Benefits of Observability Tools
There are numerous benefits of Observability tools. Be it for root cause analysis, alert generation or error detection, the insights they generate are invaluable, especially in environments with microservices architectures or distributed systems, where pinpointing problems can be extremely challenging.
Observability tools uncover both known and developing problems, in that they reveal complex dependencies within your system. They are more than just reactive; they’re proactive, providing predictive analytics to identify potential issues before they escalate. By combining metrics and logs, observability tools grant a holistic perspective on your network’s health and performance. They are particularly effective in quickly evolving business landscapes, enabling teams to proactively tackle potential concerns and boost overall system performance.
“Every organization has a digital presence now. Observability is not a cutting-edge differentiator—it’s a core competency. And it’s a basic ingredient that every company needs to look at for their success.”
Mala Pillutla (Forbes Virtual Event)
Key Features to Look for in Observability Tools
When selecting an observability tool, there are several key features to consider that play crucial deciding factors, some of which include:
- Anomaly Detection: For scaling systems, anomaly detection is essential. Look for tools with AI/ML capabilities that can automatically detect anomalies. These should be based on algorithms trained on extensive datasets to identify a range of unusual behaviors, aiding in quick troubleshooting and cost reduction.
- Alerting: A robust alerting system is foundational. It should scan telemetry data continuously, notifying you of critical events based on specified conditions and thresholds. Alerts should be customizable to your business needs and deliverable through multiple channels to ensure swift action.
- Distributed Tracing: Essential for applications built with microservices architecture, distributed tracing helps in identifying the root causes of failures and performance issues. Your tool should facilitate distributed tracing to provide a comprehensive view of request execution and latency sources.
- Cost Control: Observability costs can escalate quickly. Tools should offer automated data optimization, allowing you to control data volumes and related costs effectively. This ensures you only pay for data essential to your observability needs, avoiding unnecessary expenses on irrelevant data.
- Customizable Dashboards: Given the vast volumes of telemetry data, tools with pre-built dashboards can save considerable time. These dashboards should be customizable, providing immediate insights without the need for extensive configuration.
- Service Instrumentation: Look for tools that provide automated service instrumentation, which can streamline the process of exposing logs, metrics, and traces. Features like service discovery and easy data collection are vital for quick and efficient observability setup.
- Data Correlation: The tool should offer seamless data correlation, enabling quick and efficient troubleshooting. This is particularly important in environments with microservices, where correlating data from various components is key to isolating issues.
Common Challenges for Observability Tools
Choosing an observability tool can be a complex task, fraught with several challenges that organizations need to navigate.
Some of the common challenges include:
- Integration with Existing Systems: Ensuring the new observability tool seamlessly integrates with the existing technology stack and infrastructure is a significant challenge. Incompatibilities lead to additional costs and complexities.
- Data Overload: Observability tools generate a vast amount of data. Sifting through this data to find relevant insights without getting overwhelmed or missing critical information is difficult.
- Cost Management: The cost of observability tools can vary greatly, and there is often a fine line between the features offered and the price. Balancing budget constraints with the need for a robust solution is a common challenge.
- Complexity in Use and Maintenance: Some observability tools can be complex to set up, use, and maintain. This complexity requires skilled personnel and can result in increased training and operational costs.
- Scalability: As the organization grows, the observability tool must scale accordingly. Finding a tool that can handle increased load without performance degradation is crucial.
- Real-Time Analysis and Alerting: The ability to analyze data in real-time and send timely alerts is critical. Some tools may not provide sufficiently fast analysis or customizable alerting, impacting the ability to respond to issues promptly.
- Customization and Flexibility: Different organizations have unique needs. A tool that offers customization and flexibility to adapt to specific requirements is essential but can be hard to find.
- Security and Compliance: Ensuring the observability tool complies with industry standards and security regulations is a major concern, especially for organizations in highly regulated sectors.
- Support and Vendor Reliability: Dependable vendor support is crucial for troubleshooting and resolving issues. Evaluating the reliability and responsiveness of the tool provider is necessary.
- Determining the Right Features: With a plethora of features available, determining which are necessary for the organization’s specific context requires time and research.
Choosing the Best Observability Tools
The right observability tool should offer a blend of proactive alerting, intelligent anomaly detection, cost-effective data management, easy-to-use dashboards, efficient data correlation, automated service instrumentation, and comprehensive distributed tracing capabilities.
Moreover, navigating the challenges associated with choosing the right observability is imperative. Careful consideration, research, and often a degree of trial and error are required to find the observability tool that best fits your organization’s unique needs and constraints.
Explore Apica’s Observability Solutions
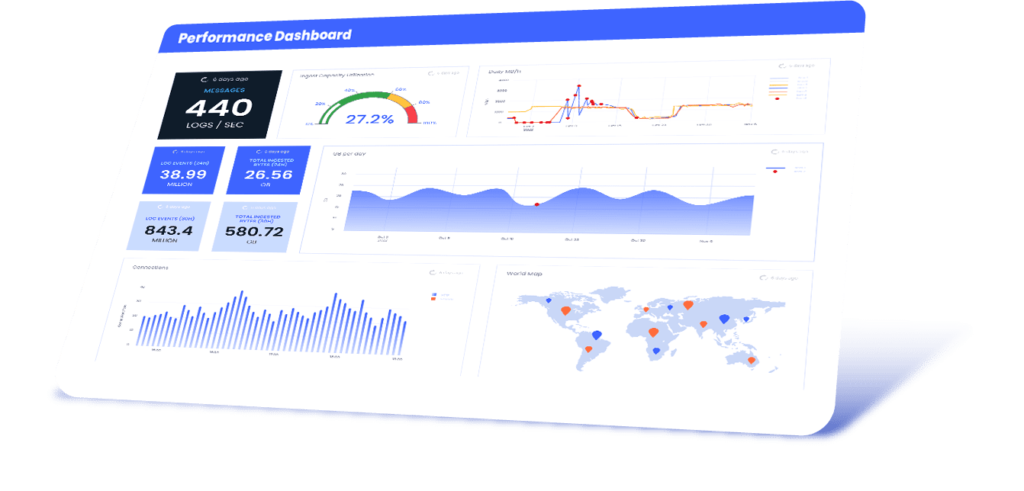
Apica’s ascent platform is crafted to integrate smoothly with your existing tech infrastructure, offering in-depth insights into system performance and health.
Moreover, our focus on user-friendly interfaces and robust analytics ensures efficient handling of large data volumes.
Furthermore, Apica is the first data fabric to integrate Generative AI into its platform. Our Active Observability approach provides a comprehensive understanding and proactive management of your digital environment.
Conclusion
In the era of DevOps and continuous integration/continuous deployment (CI/CD), observability tools are imperative. They should integrate seamlessly into the development lifecycle, facilitating faster and more efficient releases without sacrificing quality.
Keep in mind that observability tools go beyond simple network monitoring; they offer a comprehensive view of the vitality and efficiency of your digital landscape. Whether you’re just starting or advancing your journey in observability, it’s imperative to precisely identify how these tools will integrate into your infrastructure and the specific insights you intend to extract from them.
TL; DR
- Selecting observability tools involves evaluating enterprise compatibility, researching, and considering specific needs.
- Observability tools analyze system data like logs and metrics, addressing both predictable and unforeseen issues.
- Benefits include enhanced error detection, predictive analytics, and effective problem-solving in complex systems.
- Essential features: anomaly detection, alerting, distributed tracing, cost management, customizable dashboards, service instrumentation, and data correlation.
- Challenges: integrating with current systems, managing data and costs, tool complexity, scalability, real-time capabilities, customization, security, vendor support, and feature selection.
- Ideal tools combine proactive alerting, efficient data management, user-friendly interfaces, and comprehensive tracing.
- Apica’s solutions emphasize seamless integration, ease of use, robust analytics, and Generative AI.
- Observability tools are crucial in DevOps for efficient, quality software releases, offering a holistic view of digital infrastructures


