Telemetry Pipeline Insights & Observability Best Practices
Articles, guides, and deep-dives on modern observability, telemetry pipelines, AI-era infrastructure, and reducing the cost of visibility at scale.
SecurityDevOpsLog AnalysisMonitoringObservability
The Importance of Event and Endpoint Logs in Security
Modern organizations are under a constant threat of cyberattacks, unauthorized data access, and identity theft. A simple network monitoring system alone cannot provide enough security for their vast and complex IT infrastructure, customers, and employees.
SecurityAIOpsBig dataObservability
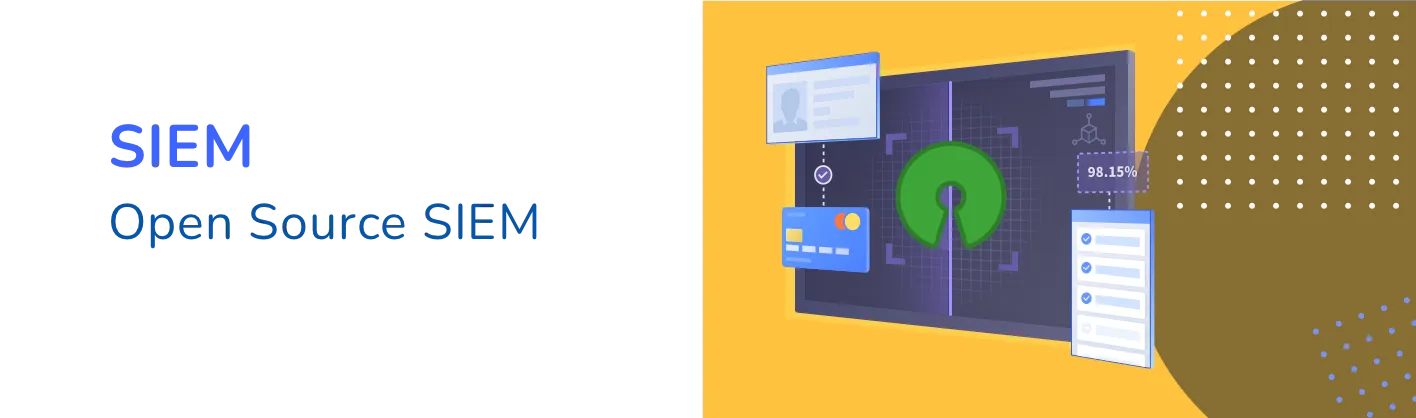
8 Best Open Source SIEM Tools
SIEM tools are fast turning into a must-have for security-focused businesses worldwide. With their proven abilities in threat protection, detection, and mitigation, SIEM systems are beneficial in safeguarding businesses from unwanted threats. Our last post
SecurityAIOpsBig dataDevOps
A Beginner’s Guide to SIEM
IT environments of any organization around the world are constantly under threats of cyberattacks. To stay safe and miles ahead of potential attacks, organizations continually tighten security regulations and focus on reducing their attack surfaces.
ObservabilityBig dataDevOpsLog AnalysisMonitoring
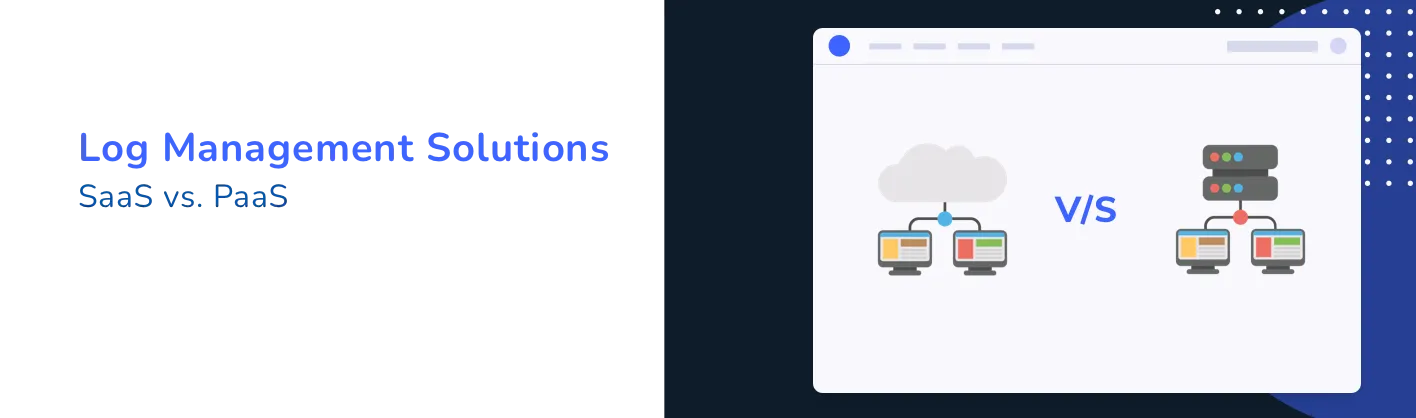
Comparing Log Management SaaS and PaaS Solutions
With the ever-increasing complexity in today’s software stacks, there’s a greater need to ramp up an organization’s observability capabilities to take on challenges brought about by cloud technology. A robust observability mechanism helps organizations detect
CNCFDevOpsKubernetesSecurity
How to Configure Kubernetes RBAC, Network Policies, and Runtime Privileges
Kubernetes is an open-source cluster management system with many applications in the world of business and commerce. Kubernetes was first developed by Google in 2014 and was heavily influenced by Google’s Borg cluster management system.
AWSS3
Monitoring your ECS Fargate logs with AWS FireLens and Apica
Amazon Web Services (AWS) Fargate is a serverless compute engine for containers that works on Amazon ECS and EKS. AWS FireLens is a log routing agent built for ECS containers and enables administrators to use
RabbitMQ is one of the most popular hybrid message brokers available today. It brokers inter-service communication between distributed microservices that make up an application. RabbitMQ consists of the RabbitMQ exchange and message queues and sits
Get More Value from Data Through Log Visualization
Why do you keep logs? Regardless of the type of logs we’re talking about, you keep them because you expect them to provide some value for the organization. Maybe the logs will help you improve profitability; perhaps
Kubernetes monitoring and observability in 4 simple steps
Kubernetes is a go-to solution for most cloud operators when it comes to container orchestration in distributed environments. Kubernetes performs phenomenally well when automating web server provisioning based on traffic, scaling and degrading servers based
Kubernetes is one of the leaders in the container orchestration market. A recent survey by Cloud Native Computing Foundation (CNCF) suggests that 84% of companies are running Kubernetes containers in production. However, organizations running Kubernetes
CloudDevOpsKubernetesMonitoringObservability
Deploying Apica on MicroK8s using a Helm Chart
In a previous article, we showed you how to deploy your favourite application on MicroK8s using a Helm chart. In that article, we used the Apica Helm chart as the example application we were deploying
DevOpsKubernetesMonitoringSecurity
How to secure your Kubernetes control plane and node components
Kubernetes is an open-source container orchestration platform designed to run distributed services and applications at scale. A K8s or Kubernetes cluster contains several components that are a part of either the Kubernetes control plane or