Self-Assessment: Calculate Your Telemetry Pipeline Readiness Score
This self-assessment framework will help you gauge your readiness across six dimensions.
INTEGRATIONS
Integrate with any data source, notify any service, authenticate your way, and automate everything.
Apica Product Overview
Videos
Events & Webinars
Join us for live and virtual events featuring expert insights, customer stories, and partner connections. Don’t miss out on valuable learning opportunities!
DOCUMENTATION
About Us
Security
News
Stay updated with the latest news and press releases, featuring key developments and industry insights.
Leadership
Apica Partner Network
Careers
Get Started Free
Load Test Portal
Ensure seamless performance with robust load testing on Apica’s Test Portal powered by InstaStore™. Optimize reliability and scalability with real-time insights.
Monitoring Portal
Integrate with any data source, notify any service, authenticate your way, and automate everything.
Apica helps you simplify telemetry data management and control observability costs.
Fleet Management transforms the traditional, static method of telemetry into a dynamic, flexible system tailored to your unique operational needs. It offers a nuanced approach to observability data collection, emphasizing efficiency and adaptability.
100% Pipeline control to maximize data value. Collect, optimize, store, transform, route, and replay your observability data – however, whenever and wherever you need it.
Apica’s data lake (powered by InstaStore™), a patented single-tier storage platform that seamlessly integrates with any object storage. It fully indexes incoming data, providing uniform, on-demand, and real-time access to all information.
The most comprehensive and user-friendly platform in the industry. Gain real-time insights into every layer of your infrastructure with automatic anomaly detection and root cause analysis.

This self-assessment framework will help you gauge your readiness across six dimensions.

The 10 essential steps organizations must take before implementing a telemetry pipeline.

The difference between a pipeline that reduces cost and accelerates innovation versus one that becomes yet another layer of complexity comes down to preparation.

OpenTelemetry solves instrumentation and interoperability. It doesn’t solve the cost problem. That requires something more.

Drowning in observability data? Learn 5 critical reasons why telemetry pipelines cut costs by 40%, improve incident resolution, and eliminate vendor lock-in.

As the cloud continues to evolve at lightning speed, driven by generative AI, heightened security demands, and the need for cost efficiency, Apica is stepping

This guide breaks down what telemetry pipelines are, how they work, and how Apica Flow helps you cut costs, improve reliability, and stay compliant.

ServiceNow has announced that Cloud Observability (Lightstep) will reach end-of-life on March 1, 2026, or your contract term end date—whichever is later. If you’re concerned

The European Union Data Act (Regulation EU 2023/2854) represents a landmark shift in data governance that became enforceable on September 12, 2025. This comprehensive legislation

Why there’s a need for a new approach to observability and data economics that puts enterprises back in control.

Learn how fluentbit works and how to configure fluentbit for production log gathering in this step-by-step comprehensive guide.

Learn how distributed tracing works, best practices, major challenges, and explore what are the best distributed tracing platforms in 2025.

The observability landscape is at a critical inflection point. As enterprises grapple with exploding telemetry data volumes and spiraling costs, many find themselves trapped in

A focused comparison of profiling vs tracing in OpenTelemetry, including how they complement each other and when to use each.

Discover how vendor lock-in stifles observability and quality data collection in today’s analytics-driven landscape.

The observability market has a dirty secret: It’s drowning organizations in complexity and cost. While legacy platforms lock you into proprietary agents and force you to pay premium prices for basic insights, we’ve been building something different.

How the industry’s obsession with dashboards and analytics ignores the fundamental data quality crisis happening at collection.

Picture a scenario where everyone in your office brings their printer. Some use inkjet printers, some use laser printers, and some barely work. They all require setup, take up space, and necessitate different levels of support. Most printers do the same thing: print documents, but no one shares them, and support teams are stuck fixing all of them.

In the financial sector today, CIOs face a dual challenge: Reducing IT expenditures and supporting other business units while ensuring strict adherence to regulations like GDPR, PCI-DSS, and SOX. This balancing act becomes increasingly complex as observability data volumes grow exponentially.

In today’s digital-first enterprises, telemetry data is essential—but without control, it becomes a liability. From skyrocketing storage bills to limited visibility across siloed tools, organizations are struggling to make telemetry data useful, secure, and cost-effective.

When observability is brought up, many assume it will lead to substantial costs. The various tools and resources needed for different monitoring requirements can cause

The recently released EMA Research Report “Taking Observability to the Next Level: OpenTelemetry’s Emerging Role in IT Performance and Reliability” provides compelling evidence that OpenTelemetry

Every year, new trends and patterns emerge in the observability world. Some recur, and some develop with the changing data and technology landscape. Observability in

Join us at KubeCon + CloudNativeCon EU to see how the Ascent platform is helping organizations tackle their most complex telemetry data management + observability

Quick Overview SigNoz and Flume are strong all-in-one platforms combining logs with traces and metrics. Grafana Loki excels in Kubernetes, thanks to efficient indexing and

Hey there! Oscar here. After spending countless hours wrestling with various monitoring tools and proprietary solutions, I wanted to share my thoughts on what I

As we navigate through 2025, Site Reliability Engineers face unprecedented challenges in maintaining system reliability and performance at scale. With the rapid evolution of distributed

In the rapidly evolving IT environment, observability at scale has become a critical challenge for organizations aiming to maintain operational excellence. The proliferation of telemetry

Powered by InstaStore™ Navigating the complex world of digital infrastructure takes more than just tools. It requires a powerful, intuitive companion. Today, we’re giving teams

Comprehensive observability for your Generative AI and LLM applications in production environments By John Ward, technical account manager, Apica The rapid advancement of AI technology

As we soon enter 2025, I want to share a fundamental truth that has guided our strategy at Apica: the quality of your observability insights

In today’s fast-paced development environment, quality testing requires two critical elements: comprehensive monitoring and intelligent test data management. Today, we’re excited to announce that Apica

In today’s data-driven world, data is the lifeblood of businesses. As organizations strive to extract maximum value from their data, the concept of “data orchestration”

Blog summary Modern observability platforms are transforming how organizations handle application performance monitoring and troubleshooting. Key takeaways: Critical Challenge: Application teams and IT infrastructure teams

In today’s complex and dynamic digital landscape, observability has become a cornerstone for organizations seeking to understand, manage, and optimize their applications and infrastructure. As

Article originally published on Forbes Technology Council AIOps emerged as a response to modern IT systems’ overwhelming volume and complexity of data. These tools were

It is evident that artificial intelligence is the driving force behind the swift developments in enterprise technology. Part of that is the rising urge to

In telemetry, “fleets” refer to groups of data collection agents or collectors deployed across various hosts and environments within an organization.

An economic, vendor-agnostic telemetry pipeline designed for unified, large-scale data management.

Tool Sprawl is real and unified observability is the key to unlocking this hindrance, along with the many others in your IT monitoring. Some say

In the current high-volume business environments, the demand for accurate and available data is higher than ever. Traditional data management solutions often fall short, escalating

Fleet management in the broader sense is about managing, organizing, and coordinating assets within an organization to ensure efficiency, reduce costs, and maintain compliance. The

A detailed overview of log analytics, what log analytics is used for, the many benefits associated with it along with Apica’s best practices.

Today, we are excited to announce that we have partnered with Boomi to provide its customers with unparalleled observability capabilities on its integration platform. Boomi

Today, we’re adding to the groundwork we’ve established to provide enterprise organizations with a modern approach to data unification to improve insights. Our True North

Explore the many uses, benefits, and common challenges of data lakes and how Apica’s data lake solution can help.

We are thrilled to announce that Apica Ascent has been honored with the prestigious Champion badge in the 2024 Application Performance Management – Emotional Footprint

Explore the key deciding factors in choosing the best Observability Tools for your Enterprise in 2024.

OpenTelemetry vs Prometheus is a commonly searched and debated topic in the Observability and monitoring space. While both platforms are widely used in software and

In a world where the only constant is change, the onset of 2024 brings with it a slew of technological advancements and challenges. Predicting the

In a significant achievement in digital transformation, APICA has been honored with the prestigious Winter 2023 Intellyx Digital Innovator Award. This recognition comes from Intellyx,

Apica’s Ascent has achieved remarkable results in the 2023 Application Performance Management Data Quadrant Report published by SoftwareReviews, a notable source for insights on the

Explore why Apica is the best low cost Log Management Solution You Need in 2024.

“Isn’t observability just a fancy term for monitoring?” That’d be the response from most IT folks a few years back if you asked them about

An Essential Guide to OpenTelemetry In today’s expeditious, highly distributed software landscape, achieving true observability is no simple task. As you strive to understand how
The dynamic landscape of technology has ushered in a new era of data management and storage. As organizations grapple with the vast amount of data

If generative AI is innovative for enterprises in 2023, being cloud-based is ubiquitous. What that means is that the data today is extremely voluminous and

In the ever-evolving landscape of technology and business, mergers and acquisitions have become a common occurrence. The latest buzz in the tech world revolves around

Microservices architecture has become increasingly popular in modern software development due to its scalability, resilience, and flexibility. However, with the benefits of microservices come the
In the ever-evolving landscape of digital performance monitoring and observability, Apica has proven once again that it stands at the forefront of innovation. The recent

In the world of observability, having the right amount of data is key. For years Apica has led the way, utilizing synthetic monitoring to evaluate

In the previous article, we talked about Distributed Tracing with MuleSoft APIs using OpenTelemetry. In this post, we’ll go through the process of integrating Distributed

Distributed tracing enhances observability by providing detailed insights into the performance, behavior, and dependencies of your distributed system. It empowers you to proactively identify and

Data Centralization emerges as a necessity in the cloud world now that data is omnipresent. Gone are the days when different teams had to rely

Centralized Observability may not be a buzzword but its practicality and importance can’t be denied. Let’s see why is that. As DevOps and IT teams

Prometheus, developed by SoundCloud, is a powerful open-source system for service monitoring and time series data storage. It collects metrics from configured targets, evaluates rule

In today’s data-driven world, the need for comprehensive observability has never been greater. Organizations rely on observability to gain insights into their systems’ and applications’

Log Management tools are crucial for the security and performance of your IT infrastructure. With the right log management system, you can quickly detect and

Mainframe Observability may be a niche term for the general crowd but Mainframe, in and of itself is not. From countless references in espionage movies

The Prometheus Node Exporter serves a crucial purpose in cloud-native monitoring. It acts as a connecting bridge between third-party applications and the Prometheus server, enabling

Thanos and Prometheus are highly robust systems that offer fast and dependable monitoring capabilities. But what makes each system different? Prometheus is a time-series database

Syslog-ng is a freely available and open-source interpretation of the Syslog protocol. It functions as an improved log daemon and offers extensive support for various

Discover the emerging paradigm of Fungible Observability with apica.io.

AWS CloudWatch Logs provides a comprehensive solution for monitoring, storing, and accessing log files generated by various sources such as Amazon EC2 instances, AWS CloudTrail,

The Amazon Elastic Kubernetes Service (EKS) has integrated support for EC2 Launch Templates and custom AMIs to enhance the configuration and customization options for Amazon

AWS Firelens functions as a log routing agent exclusively designed for containers that operate within Amazon Elastic Container Service (ECS). As a reminder, applications on

Find out why data fabric is critical for businesses wanting to scale, what features make for an ideal solution, and how to utilize them.

Learn how to configure AWS Elasticsearch with Apica to achieve interactive log analytics, real-time application monitoring, website search, and more.

How Machine Data Analytics Unlocks Business Growth Opportunities

Discover how you can use apica.io to configure your AWS CloudWatch and X-Ray services for a comprehensive log data management solution.

Amazon Athena is a powerful interactive query service that makes it easy to analyze data in Amazon S3 using standard SQL queries. apica.io supports Amazon

If you’re a DevOps engineer, IT personnel, or developer, you’re likely very familiar with telemetry data. After all, it’s what provides you with valuable insights

Anyone who has ever needed to work on spreadsheets is thankful for automation. Nothing is as dull as copying and pasting information a thousand times.

According to DevOps Global Market Report 2022 by Research and Markets, the DevOps market is projected to hit a staggering $20.53 billion by 2026, with

Kubernetes monitoring is crucial as it adds yet another level of complexity to the already complex IT infrastructures. When implementing Kubernetes, it is essential to

It is quite difficult to acquire useful insights for businesses when dealing with massive amounts of data generated by systems. The challenge is compounded when

We at Apica are elated to announce that we’ve been granted a patent for our unique innovations in the field of operational data management and

Enterprises today need to make data-driven decisions to remain competitive in the market. However, managing the vast amounts of data generated from applications and infrastructure

According to a recent global survey conducted by Dimensional Research, 96% of respondents are experiencing a surge in log data. The survey also highlights that

A comprehensive guide to what is Log Management, Best practices to follow, and the best log management tools It is projected that the Log Management

Part Four of the Humanizing Software Quality Series from Intellyx, for Apica In part 1 and part 2 of this series, Jason English established user

AIOps and Observability have been in the limelight for a while now. Chances are that you’ve already heard about their potential to revolutionize the IT

In a Glimpse Root cause analysis is a process used to identify the underlying cause of a problem or event, and topology timelines are an

The theory of the multiverse states that every possible outcome takes place somewhere, and from sausage fingers to pig superheroes from another dimension, Hollywood loves

Find out what is an Operational Data Fabric and what is it about. Get a detailed explanation of what are the key challenges, advantages, and

OpenTelemetry also known as OTEL or OTel informally, is a community-driven open-source project. In other words, it is an observability framework that includes software and
Observability and event log data are important. What’s more important, however, is the ability to figure out the relevance of the data. In other words,
Apica offers a suite of powerful AWS observability tools to help you monitor, troubleshoot, and understand the performance of your system.

The on-premise setup, widely known as an “on-prem environment” or “self-hosted environment“, allows organizations to customize their infrastructure while avoiding the costs associated with public
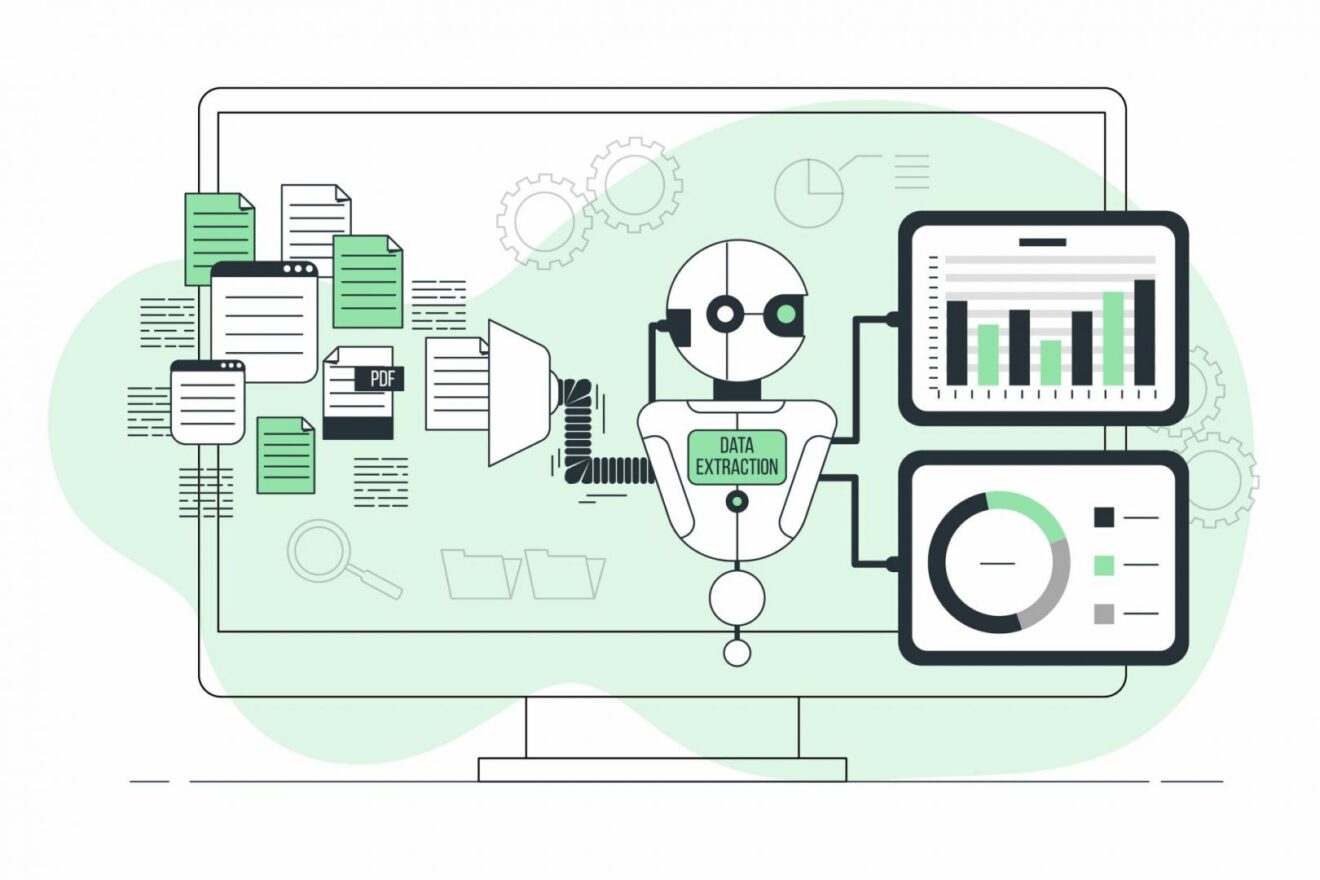
Machine data analytics refers to the process of collecting, storing, and analyzing massive amounts of data generated by machines, such as sensors, industrial equipment,

Part Three of the Humanizing Software Quality Series from Intellyx, for Apica In part 1 of this series, Jason English established user journeys as the

Machine learning is a subfield of artificial intelligence that involves using algorithms and statistical models to allow machines to learn from and make decisions based

IoT or the “Internet of Things” is one of the most popular technical terms that you’ll hear in business. Now, with the unprecedented growth of

With the onslaught of the data wave in recent years, it has become excruciatingly difficult for DevOps, SREs, ITOps, and SecOps to pinpoint and troubleshoot

According to Gartner, Data Fabric is one of the top trends of 2022. They made a remarkable statement saying “Good decisions rely on shared data,

Most organizations use metrics to monitor their system and architecture performance. In addition, the boom in microservices has led to a demand for improved monitoring

Part Two of the Humanizing Software Quality Series from Intellyx, for Apica In our previous post, we established user journeys as the essential goal

Part One of the Humanizing Software Quality Series A brand is not defined by a logo or a tagline. Nor is it encompassed by a

It’s nearly impossible for any business to stand alone and keep all its information within the confines of the data center. Virtually every business relies

The term “observability” has gone viral in the cloud industry, at least among IT professionals. Because it describes a group of concerns that more and

In any modern containerized workload setting, container orchestration is imperative. Purportedly, the majority of contemporary applications make use of containers and micro-service-based architectures. Google designed

Distributed tracing has been recognized as an imperative feature in the DevOps toolbox for microservices over the last few years. Consequently, the open source observability

Who doesn’t love sitting down to binge the latest great show? And with streaming services increasing all the time, more and more providers are embracing

Software testing is a huge domain, but it can be broadly categorized into two areas: manual testing and automated testing. Both manual and automated testing

Full Stack Observability is a term you may have heard being tossed around in many conversations around observability or monitoring in general. But what does

Observability data has three types: metrics, traces, and logs. Metrics are numerical values that represent some aspect of a system at a given point in

If you’re using an observability stack, chances are you’re familiar with alerting. Alerts help users get notified when something interesting happens that they need to

Businesses everywhere are going through digital transformation. This means that they are adapting their operations and strategies to better compete in the digital age. A

With the constant increase in applications being used both inside an organization and by customers, it’s more important than ever to have a firm grasp

How Does Service-Level Assurance Safeguard IT? With the increasing reliance on workers who require remote access to the enterprise resources they need, companies have added

There comes a time when a company must reach beyond its current capabilities and the low-hanging fruit, to reach more elusive customers. This is a

Prometheus is a wildly deployed open source monitoring system for time series metrics. For observability use cases, it is important to bring together logs and

Monitoring application performance is more important than ever. With an ever-growing catalog of applications in need of support, and IT architecture increasing in complexity, ensuring

Metrics are the primary means of representing your system’s general health and any other valuable information for monitoring, alerting, and observability. Despite the Kubernetes ecosystem

For all the productivity gains created by DevOps, there’s a nasty side effect. Short release cycles, lots of infrastructure changes, and developer-driven changes to live

Guest post originally published by Greg O’Reilly on Visibility Platforms’ blog. In late 2021 we kick started a project with a customer who had shown

It’s likely that you already know how helpful logs can be in analyzing the inner workings of your IT environments. Beyond that, you may be

In January, the apica.io team shipped plenty of new features, enhanced existing ones, and squashed a few bugs to make your Active observability and data

Understanding your Kubernetes cluster’s internal dynamics is critical for system and application performance. Reading, analyzing, and evaluating your logs allow you to fine-tune your applications
Containers, services, and cloud-based apps have changed the way companies produce and deliver products and services and do business worldwide. This has altered the attack

In May 2018, Twitter stated that they detected a vulnerability that unintentionally entered user credentials into their logging system. A year later, Facebook urged all

You may need to commit more effort and resources to ensure that your IT infrastructure is appropriately monitored and protected as it becomes more extensive,

Plain-text log maintenance is a thing of the past. While plain-text data is still helpful in certain situations, it pays to invest in reliable log

What’s Log4j? What is it used for? Log4j is a widely used Java logging library used in many Java enterprise applications. Because logging is so

What’s Log4j? What is it used for? Log4j is a popular Java logging library widely used in many Java enterprise applications. Because logging is so

As a business, you’re bound to have large numbers of interactions with customers, prospects, employees, consultants, partners, and third-party vendors. These interactions generate huge amounts

New secure platform delivers an ideal user experience and peace of mind for businesses. Apica Systems, the leader in service-level assurance, announced its unified platform
Spring Boot is a Spring module that combines embedded servers with the Spring Framework. It enables rapid application development on the Spring framework and provides

When large software and services are split down into micro applications or microservices, they become simpler to maintain. Microservice design has grown popular among developers

Data protection is the need of the hour for anyone and everyone working in the compliance spectrum. The number of information security, privacy regulations, and

Data breaches are on the increase; it’s no secret. Almost every day brings news of a large corporation disclosing the loss of personal information, along

If your organization uses AWS services, you’d agree that it can be difficult for AWS administrators to stay on top of all activities and events

Logs are essential for determining the performance and health of your system. In order to fuel an observability platform throughout your system, good logging practices

Data operations are like tuned automobiles. When all the parts operate together, the result is a stunning blend of speed and performance. If one of

We’ve previously written about how event and endpoint logs are essential for maintaining endpoint and overall system security. A breach at an endpoint could quickly

Tiered storage is a method of data management that assigns data to various kinds of storage devices/media based on the current value of the underlying

An overview of Splunk costs Did you know that utilizing Splunk to index 5 GB of data per day would cost you more than $30,000?

What characteristics distinguish an effective data observability platform? Data observability platforms enable the tracking of downstream dependencies in order to remedy the underlying issue. The

As production settings grow more dispersed and ephemeral, SecOps and DevOps teams struggle to comprehend system availability and performance. Despite the proliferation of monitoring solutions

While data pipelines may move data, they cannot monitor it. These data pipelines are complicated systems that need a data observability architecture for continuous investigation

The application of analytics in the industry is widespread and diverse. From connecting all elements of a technological ecosystem to learning from and adapting to

Amazon S3 is often the platform of choice for companies looking to store corporate data, address their ever-increasing data storage needs, and even host static

When it comes to IT observability and monitoring, machine data pipelines form the nerves if your observability platform is the nerve center. They create channels

At apica.io, we architect and build our software for infinite scale. Infinite scalability was part of our Day 0 thinking. Our system is also designed

We’re in the middle of what is now widely acknowledged as the fourth industrial revolution. The digitization of industrial and manufacturing processes has transformed the

Data scientists and analysts are heroes and MVPs today, with the ability to alter your organization with near real-time analysis and eerily accurate predictions that

Have you ever questioned what it takes to be a truly data-driven company? To make important decisions, you must have faith in the accuracy and
Deploying Splunk doesn’t come without challenges. It is common knowledge that Splunk is quite a fantastic tool for monitoring and searching through big data. In

Modern IT environments are becoming increasingly distributed in nature. Distributed environments have a large number of interdependent and interconnected parts, making them more susceptible to

We live in a complicated world of Enterprise IT and software-driven consumer product design. The internet offers IT infrastructure services from remote data centers. Companies

A large percentage of organizations today tend to spend way too much on compute resources and storage. For instance, investing in high capacity on-premise data

Gaining business intelligence by sifting through TBs of system-generated data is challenging. Imagine doing this at scale while also having to converge data from disparate

Credit card fraud is a term used to denote fraud committed using credit or debit cards. Credit card fraud is often backed by stolen, unauthorized,

Endpoints in an IT environment generate logs related to access, operations, events, and errors. A security breach on an endpoint could direct attackers to the

Modern organizations are under a constant threat of cyberattacks, unauthorized data access, and identity theft. A simple network monitoring system alone cannot provide enough security

SIEM tools are fast turning into a must-have for security-focused businesses worldwide. With their proven abilities in threat protection, detection, and mitigation, SIEM systems are

IT environments of any organization around the world are constantly under threats of cyberattacks. To stay safe and miles ahead of potential attacks, organizations continually

With the ever-increasing complexity in today’s software stacks, there’s a greater need to ramp up an organization’s observability capabilities to take on challenges brought about

Kubernetes is an open-source cluster management system with many applications in the world of business and commerce. Kubernetes was first developed by Google in 2014

Amazon Web Services (AWS) Fargate is a serverless compute engine for containers that works on Amazon ECS and EKS. AWS FireLens is a log routing
RabbitMQ is one of the most popular hybrid message brokers available today. It brokers inter-service communication between distributed microservices that make up an application. RabbitMQ

Why do you keep logs? Regardless of the type of logs we’re talking about, you keep them because you expect them to provide some value for the
Kubernetes is a go-to solution for most cloud operators when it comes to container orchestration in distributed environments. Kubernetes performs phenomenally well when automating web

Kubernetes is one of the leaders in the container orchestration market. A recent survey by Cloud Native Computing Foundation (CNCF) suggests that 84% of companies
In a previous article, we showed you how to deploy your favourite application on MicroK8s using a Helm chart. In that article, we used the

Kubernetes is an open-source container orchestration platform designed to run distributed services and applications at scale. A K8s or Kubernetes cluster contains several components that

Engineering and developing a world-class product in a distributed environment is challenging. When said engineering needs to be carried out by a team that is

ApicaHub is officially live! ApicaHub is a collection of pre-built, ready-to-use dashboards for monitoring and observing important metrics for popular infrastructure and cloud services. Using

If your company uses or offers services or products over the cloud, the onus is always on the provider to ensure that information shared by

APIs – by now, we’re all familiar with the term. Every service or software we use or build today either uses or is an API.

Log data contains tons of information – the more complex the system producing the logs, the more information the logs have. Imagine going through endless
Cloud computing is everywhere. An ever-increasing number of businesses have turned to the cloud for their storage, compute, analytics, content management and business operations demands.
Originally published at The New Stack Most log management solutions store log data in a database and enable search by storing an index of the

If you’ve been looking for an inexpensive way to run your own observability stack while maintaining complete control over your data and its security, look
There’s no one-size-fits-all approach regarding application monitoring, especially for companies using applications in various cloud environments. Companies are rapidly investing in microservices, mobile apps, data
Logging and log management are critical aspects of modern IT management, monitoring, and security. Regardless of whether your IT systems follow monolithic or microservices architecture,

AWS CloudWatch is an observability and monitoring service that provides you with actionable insights to monitor your applications, stay on top of performance changes, and

We’re huge fans of Helm Charts and the simplicity they bring to complex application deployments on Kubernetes and MicroK8s. We showed you how you could use

The growth in information architecture has urged many IT technologies to adopt cloud services and grow over time. Microservices have been the frontrunner in this
“We Can’t Build Tomorrow Using Yesterday’s Tools“ Scott McDonald IT infrastructures have been evolving constantly and rapidly, along with Big Data. Businesses worldwide are moving

In this article, we’ll walk you through how you can import, visualise, and analyse your Jenkins logs using the Apica observability platform.
Apica’s observability stack is predominantly written in Go. As a team, we love the simplicity of the language and the tooling that comes with it.

Helm is a Kubernetes package manager that helps you find, share, and use software built for Kubernetes. With Helm Charts, you can bundle Kubernetes deployments
Kubernetes is one of the most popular choices for container management and automation today. A highly efficient Kubernetes setup generates innumerable new metrics every day, making monitoring
Building and managing cloud infrastructure manually can be quite the task; even more challenging when you’re operating as a distributed team. With everyone pushing multiple
As more businesses begin to use the cloud, log visualization tools are becoming more and more important. Here are the top log visualization tools.

If you’re learning or have already learned Python programming language, it’s time to polish your skills. Learn the python logging best practices here.

Does your organization use Kubernetes? Is this container orchestration platform running over budget? Take control with these Kubernetes cost optimization tips!

Monitoring tools in ITOps are crucial, allowing you to ensure the most optimal performance. What are some top monitoring tools and use cases?

Logging is important for IT management. Did you know there are different methods? Read on to learn more about log management best practices.

Lowering cloud spend is something many companies are striving to accomplish. Use this guide on how to use chaos engineering to reduce cloud spend.

Do you have an incident management process set up? If not, you need one. Make sure you keep reading below to learn why it’s so important.

Prometheus is not just different but also better than other monitoring systems. Discover the complete Prometheus tutorial for beginners here.

There are many challenges in ELK stack logging that you may need to be aware of. Here are some of the top ELK stack challenges.

The TCO, or the total cost of ownership, involves evaluating the value over time. Take a look at the TCO of the ELK stack in this analysis.

Docker has helped scale software development, improved system utilization, and workload distribution. But how do you design for docker performance monitoring?

Machine log collection, management, and analytics are essential for a company to thrive in the information age cloud business. I recently learned how a top-performing

When it comes to products and services, reliability, availability, and maintainability are often grouped as desired attributes. It happens so often that they have their

What are the best practices in Kubernetes monitoring? There are a variety of open-source tools you can use for monitoring Kubernetes.

Considering Cloud monitoring for your DevOps team? Click here to learn the best practices for implementing this strategy.
Successful software companies are all about productivity and quality in the name of service to the end-user. Learn more about DevOps metrics here.

Learn all about the AIOps workflow, from data ingestion all the way through to incident resolution.

Using AIOps for Kubernetes clusters has many benefits, but what are they exactly? This guide explains what you need to know.

Learn what AIOps is and how it uses artificial intelligence to enhance IT operations’ efficiency by automating processes and eliminating excess work.

Log aggregation tools : Design Considerations

Monitoring tools such as Prometheus allow a developer to measure application performance with a few lines of code. However, code changes to the application are not

Application monitoring is one of the highest IT priorities in today’s business. If you’ve been using an outdated solution that doesn’t support all the different

Just before the pandemic changed our lives with the new working from home experience, we had the opportunity to meet with our customer advisory board

Database indexes are invaluable for information systems with low throughput, low latency, and high consistency requirements. Both compute, and disk space is required for creating

AWS Firelens is a log routing agent for Amazon Elastic Container Service (ECS) containers. Applications on ECS run as docker containers. Containers can be run on

Introduction In this multi-part series, we are going to explore log formats and protocols for sending them: two of the most fundamental pieces of any

We are all accustomed to search. We search to find answers. In the log analytics world, those answers have improved customer retention, aided better decisions.
Searching through logs becomes ineffective when unknown unknown abound and data volume grows. Log visualization is key to help navigate large data volume. In most

Apica, Creator of Apica Insights: a complete observability platform for monitoring, log aggregation, and analytics with infinite storage scale, has released General Availability of Apica Insights 1.2. Apica’s 1.2

Change is never easy, but a necessity as legacy software can’t keep up with the current needs or demand. Case in point is what we
The Apica team is super excited to join CNCF. The Cloud-native computing foundation is a great community of cloud builders and projects that is shaping
apica.io is officially GA Apica officially is now GA, See our press release – https://www.prnewswire.com/news-releases/Apica-log-insights-the-only-s3-powered-log-aggregation-and-analysis-solution-301002188.html A great milestone for the team. Stay tuned for more
Right, a few months ago, few of us came together with one mission: To give log analytics its much-desired wings. BTW It’s not just AWS
Object storage does away with the tree-like hierarchical file system of NAS and replaces it with a flat structure in which all objects have a

With the continued growth of applications being used in and out of an organization, getting a firm grasp on the performance of these devices and

HBO is one of the world’s leading entertainment providers. Its premium cable programs and on-demand streaming services are popular worldwide, bringing hit movies and original

The two buzz words this year have been the “Connected Car” and “IoT Device.” The automotive industry has taken the lead in ensuring both are

Loadtest Bamboo deploy package on Atlassian Marketplace This package has been tested with Bamboo version 6.8. Overview The LTP Atlassian Bamboo plugin makes it possible

Supporting desktop apps for a variety of environments can be tricky for developers. That’s why rigorous desktop app monitoring is necessary. This article explores the

Using Grafana to Visualize Apica Monitoring Metrics By Sven Hammar, CPO at Apica Systems We have always provided Apica users with the best graphical reports

For the second piece in this series on monitoring for fun and profit we will focus on RUM/RUA. As was done previously will generically define

For the second piece in this series on monitoring for fun and profit we will focus on RUM/RUA. As was done previously will generically define

ITRS Group (“ITRS”), the leading provider of real-time monitoring and IT operations analytics to financial services firms, has announced a partnership with Apica, industry leaders

To understand website availability monitoring, it’s important to understand synthetic monitoring. Synthetic Monitoring is a process initiated proactively by external agents (typically lightweight agents) that

By 2020, there will be billions of devices connected to the Internet of Things (IoT). From the Google Homes and Fitbits in our personal lives

When I speak to QA Managers in my daily routine, I often hear a common scenario, they own LoadRunner as their performance load testing solution,

As the holiday season approaches, the IT and Development teams for many ecommerce and online retail brands have already begun their application performance testing to

The path to application quality and performance comes in many shapes and sizes. Most organizations today use an Application Performance Management (APM) tool to monitor

Apica is excited to announce our new partnership with AppDynamics. The content below is from the AppDynamics blog. IDG research* suggests nearly a third of

In addition to measuring performance metrics, website and application monitoring tools can help your company’s developers write better code by identifying changes that hurt efficiency.

Mobile customer engagement service Mobify is projecting that 2017 is the year that people will spend more money on mobile platforms than traditional desktop computers on Black Friday.
As businesses invest in Internet of Things technologies for new opportunities, it’s important to understand how technical and social factors play in to how well-primed

Needless to say, top-notch web performance is crucial for any company, regardless of size. But how do you know if you’re watching the right website

A distributed denial of service attack, or DDoS, is a bad enough inconvenience concerning your company’s website and application performance, so it’s even more frustrating

Internet of Things devices serve as one of the most exciting opportunities for businesses to grow but come with the caveat of far greater reliance

The most recent major distributed denial-of-service attacks have stemmed from hackers hijacking countless Internet of Things devices and using them to create massive botnets to
We’re just over a week away from Velocity San Jose 2017. As a proud sponsor of the show, we’re excited to meet all the systems

Application Performance Management, or APM, refers to the practice of monitoring software availability and performance. However, performance management tools go far beyond just measuring uptime

Amazon’s S3 in Northern Virginia caused large-scale disruption for many companies – not to mention the financial consequences of dreaded downtime. There are several important

Mobile application overload outages quickly eat into your business’s bottom line. The right preparation, load testing, and monitoring can help your business keep an eye

and application monitoring provide immensely helpful information for improving your online platform’s performance-based customer experience. However, that information is only as useful as what your

Update March 8th, 2017 We’ve been contacted by representatives from Express.com who stated that their S3 instance was effected by the outage but did not

API TESTING SERIES Testing teams face several unique challenges when testing Application Programming Interface (API) implementations. API testing is part of the integrations testing process

API TESTING SERIES nterface (API) testing, part of the integration testing process, aims to ensure APIs work optimally by identifying bugs in the programming that

API TESTING SERIES Application Programming Interface (API) testing aims to secure and optimize communication between different platforms. This process examines many elements including debugging, identifying inconsistencies, pinpointing

The end of shopping for 2016 is coming to a close and boy has this year been a big one. According to Fortune.com “U.S. online

In the business world, a strong first impression can make the difference between closing a deal and walking away empty-handed. This also applies to video

You have a pretty good handle on how your application works. You’ve talked the design through with your development team and maybe even sat in

Performance bottlenecks can lead an otherwise functional computer or server to slow down to a crawl. The term “bottleneck” refers to both an overloaded network

Selecting the ideal testing tool is an important step in the performance testing process that begins long before your business starts collecting data. There are

The rapid advancement of the internet has brought about remarkable changes in the way we access and share information. With ever-increasing user numbers, faster speeds,

By Sven Hammar, CPO of Apica Digital experience monitoring isn’t new, and there are many ways for enterprise companies to slice that pie depending on

Performance testing is an invaluable tool for businesses to ensure their websites and applications are functioning quickly enough to maximize user engagement. According to an

Reports of aggressive DDoS attacks, also known as cyberattacks or overload attacks, are recurring topics in the news. These attacks shake up businesses and organizations

Load testing is an essential practice for any organization looking to keep its online platforms running as smoothly as possible. Load testing creates virtual users

API TESTING SERIES Stress testing REST APIs is essential for your company to get a handle on how well your APIs are performing under demanding

Are Mocks/In-Memory Tests a Good Idea? Integration testing examines if the parts of an application can communicate and function together–and if so, how well. There

In Apica Synthetic Monitoring we can show you how your site has been performing at any given time. We can show you a plethora of metrics

This is blog post #4 in a 5 post series Blog post 1: Rising to the Occasion: Using Load Testing to Optimize Cloud Server Scaling

This is blog post 3 in a 5 post series Blog post 1: Rising to the Occasion: Using Load Testing to Optimize Cloud Server Scaling Blog

Continuous Development, Continuous Integration (CI/CD) is the new paradigm for creating and improving web applications. Ongoing development and use of incremental changes that can be

Widely used and adaptable, HTTP Live Streaming (HLS) is a video streaming protocol that adds value to your website. Find out how to conduct HLS

Apica ProxySniffer V5.1-C is now ready with major updates and new features. The new version has support for multiple IP-addresses, housekeeping for Exec Agents and

Web application load times can make the difference between your e-business thriving or dying. Speedy load times are so essential to a web application’s success

Website monitoring alerts are an incredibly helpful tool for keeping your business’s site up and running. There’s more to site tracking than just looking at

Inevitably, developers are forced to delay pushing fixes and features because other parts of the code aren’t ready. “Integration Hell” earned its name because clients

LoadTest Now Includes Enhanced Integration with AppDynamics and New Relic While at Velocity 2016 this week, we are excited to announce that our LoadTest Portal

The benefits of distributed load test centers can be seen as an invaluable tool for e-businesses that serve local, regional, national, and global audiences. The

Continuous Delivery is an appealing approach, allowing rapid application updates, so end users get features and fixes as soon as they’re ready. Developers, for their

Web and cloud applications need more than just good programming to run: The server infrastructure needs to have enough resources to handle the requests of

The ZebraTester program is filled with useful load test management tools for Google Protocol Buffer, or protobuf, messages. The mechanism not only helps streamline the load

It’s easy for a business to fall into the trap of focusing so intensely on content and capabilities for their applications that they neglect one

The API Economy not only offers incredible opportunities to explore new ways to interact with devices and services, but also allows innovators to put a

Web pages built to capitalize on the technology and traffic trends from five years ago are structurally and fundamentally unequipped to operate on the modern
Online retailers depend heavily on the holiday season for a healthy bottom line. It’s the busiest time of the year in many retail industries, and

Choosing between SOAP and REST can be difficult without knowing the advantages and disadvantages of each API standard. The differences between REST and SOAP are

App failure points–places in an application’s infrastructure, network, or API where errors typically occur–can be the downfall of good code. Whether your team is plagued

Around the world, more and more companies and government organizations are reporting massive data breaches. These breaches don’t just cost them a significant amount of

Achieving Speed and Quality with Mobile Game Development When it comes to mobile game development, speed is everything. From the business owner to the consumer,

With Mother’s Day just a few days away, many online retailers are facing a huge spike in traffic and demand. The best of these retailers

In the last decade, data has virtually exploded (pardon the pun), sending shock waves through the entire tech industry. Big Data applications have arrived at the scene

The 5 Most Common PC Bottlenecks Let’s Talk What is an SLA? SLAs (service-level agreements) are the most critical component of any vendor contract. An

Cloud Applications Require Cloud-Based Performance Testing Cloud computing provides “computing” as a utility, transforming IT services. Both the software and hardware landscape have changed in

Web Performance and Application Performance Monitoring: Two Solutions, One Common Goal In the simplest terms, Web Performance Monitoring (WPM) is an external process for monitoring

If You’re Not Monitoring, You Probably Should Be On most well-built websites — yours, hopefully, included — traffic will increase over time. It would logically

In an era characterized by the explosion of data in countless forms, real-time traffic on the internet is growing rapidly. Application streaming is one of

The Content Delivery Network (CDN) is a concept involving a group of servers used at multiple locations across the globe, each hosting the same content

If you’re feeling confused about Synthetic Monitoring, Real User Monitoring (known as RUM), and the whole performance monitoring space in general, don’t fret! You’re not

Ever since it launched in 2012, Google’s Penguin algorithm has aimed to penalize websites in their search index that use black-hat SEO techniques involving link schemes —

Your website is suddenly very, very popular (think Black Friday or Cyber Monday). Millions of people are trying to get on at once. Can your

Online customers are impatient. If your webpage takes more than just three seconds to load, you risk losing customers and revenue. There are many elements
Apica LoadTest 2.9 is a major release with several important improvements and new features, detailed below. In total, 40+ functionalities have been improved and 43

Lorem ipsum dolor sit amet, consectetur adipiscing elit. Ut elit tellus, luctus nec ullamcorper mattis, pulvinar dapibus leo.In the past decade, the speed at which

Is a single page design the future of the web? To reignite and hopefully settle the debate, we’ll be looking at the pros and cons

The ever-increasing size of the modern webpage, known affectionately as “page bloat“, is becoming a big problem. As this handy chart shows, industry insiders expect the

It’s one thing to say you should improve your website speed, and another thing when you see the numbers. Turns out there’s a ton of

Sometimes, you don’t need to have every last thing about website performance explained to you. Sometimes, you can just look at the world’s top websites

If you thought website performance issues were limited to the stuffy corporate server rooms, think again. Only a few hours ago, Washington’s new health insurance exchange

Tired of waiting for your website to load? So are your employees. So are your customers. The holiday season is just around the corner and

Employing a content management system (CMS) is a logical way to store, organize and maintain your business or nonprofit organization’s ever-increasing volumes of content. Whether

Google Compute Engine (GCE) is relatively new to the world of Cloud Computing, as such, a common question we see how does this new cloud platform

PALO ALTO, Calif.–March. 19, 2013—Apica, a leading performance testing and monitoring provider for cloud and mobile applications, has partnered with open source management company, op5 to enhance the
Manchester United has the fastest responding web site in the Premier League, according to extensive tests performed by Apica, an IT company specialised in web

In 2013, mobile devices will pass PCs to be the most common Web access tools. By 2015 media tablet shipments will reach around 50 percent

Thanksgiving weekend: the truest test of website preparation and performance an online retailer can expect to encounter. It is the culmination of months of strategizing

Thanksgiving weekend: the truest test of website preparation and performance an online retailer can expect to encounter. It is the culmination of months of strategizing

The National Retail Federation (NRF) predicts that this year’s holiday sales will increase 4.1 percent to $586.1 billion. But here’s a wrinkle in the data that

On Monday, Amazon Web Services — the leading provider of cloud services — suffered an outage, and as a result, a long list of well-known and

Last week a few of my colleagues and I flew out to Las Vegas to attend Akamai Edge 2012, Akamai’s annual customer conference. The event is

I’ve written before about how Apica’s capacity planning and load testing tools can help companies prepare for a Distributed Denial of Service (DDoS) attack, but we’ve begun to

For our latest web performance benchmark we decided to take a look at some popular music streaming sites. There are obviously dozens of websites and

With just under four months to go until the holiday season, it’s time for IT development departments to get ahead and ensure a successful and
You’ve depended on load testing and web monitoring to optimize cloud applications for years. But what if a technology came along that rivaled everything you

PALO ALTO, Calif.–July 2, 2012—Apica, a leading load testing and performance monitoring provider for cloud and mobile applications, has closed a $5 million Series C

Integrated solution will provide deeper insight on application performance to improve business results. Apica is exhibiting at the O’Reilly Velocity 2012 Conference in booth #312,

Apica Sponsors, Showcases Cloud Performance Testing and Monitoring Technologies at Cloud Connect and Cloud/GOV 2012 Apica Among Silver Sponsors for Cloud Connect Conference, Hosting Sponsor

Apica and EPiServer Team to Supply Application Performance Testing Technologies for EPiServer Customers Apica-EPiServer Partnership Extended, Apica to Offer Load Testing Technologies to Everweb Hosting

[Stockholm, Sweden, June 28, 2011.] Industrifonden is investing SEK 10 million in Apica, which tests, analyzes, monitors and improves web performance. A current investor, KTH Chalmers Capital,

Posted by Steve Wexler June 02, 2011 Tags: end-to-end APM, performance monitoring, cloud computing Channel: End to End APM, Cloud Computing, WAN & App Acceleration

A new survey done by web performance experts Apica shows that there is a very strong correlation between response times for a site and its

Apica is a leader in the European market for load testing and web performance optimization. Its WebExcellence Suite, which is provided as a cloud application
The Swedish Army is working hard to reach new young audiences online. As their web presence has become a critical part of their communications strategy,

Studera.nu is the national Swedish university application website. For this autumn’s application round the site had been upgraded to cope with the expected peak loads.

Apica announces the launch of a new free web based service for testing and analyzing web sites, www.MyWebCheck.com. This service will show e.g. response times

Apica has conducted a loadtest to verify the performance of the leading, Thomas Cook owned, Ving travel company.